Assured Guaranty [Cover Art to Follow] 2018 Annual Meeting of Shareholders and Proxy Statement
UNITED STATES
SECURITIES AND EXCHANGE COMMISSION
Washington, D.C. 20549
SCHEDULE 14A
Proxy Statement Pursuant to Section 14(a) of
the Securities Exchange Act of 1934
(Amendment No. )
Filed by the Registrant ☒ Filed by a Party other than the Registrant ☐
Check the appropriate box:
| ☐ | Preliminary Proxy Statement | |
| ☐ | Confidential, for Use of the Commission Only (as permitted by Rule14a-6(e)(2)) | |
| ☒ | Definitive Proxy Statement | |
| ☐ | Definitive Additional Materials | |
| ☐ | Soliciting Material under§240.14a-12 | |
Assured Guaranty Ltd.
(Name of Registrant as Specified In Its Charter)
(Name of Person(s) Filing Proxy Statement, if other than the Registrant)
Payment of Filing Fee (Check the appropriate box):
| ☒ | No fee required. | |||
| ☐ | Fee computed on table below per Exchange Act Rules 14a-6(i)(1) and 0-11. | |||
| (1) | Title of each class of securities to which transaction applies:
| |||
| (2) | Aggregate number of securities to which transaction applies:
| |||
| (3) | Per unit price or other underlying value of transaction computed pursuant to Exchange Act Rule 0-11 (set forth the amount on which the filing fee is calculated and state how it was determined):
| |||
| (4) | Proposed maximum aggregate value of transaction:
| |||
| (5) | Total fee paid:
| |||
| ☐ | Fee paid previously with preliminary materials. | |||
| ☐ | Check box if any part of the fee is offset as provided by Exchange Act Rule 0-11(a)(2) and identify the filing for which the offsetting fee was paid previously. Identify the previous filing by registration statement number, or the Form or Schedule and the date of its filing. | |||
| (1) | Amount Previously Paid:
| |||
| (2) | Form, Schedule or Registration Statement No.:
| |||
| (3) | Filing Party:
| |||
| (4) | Date Filed:
Persons who are to respond to the collection of information contained in this form are not required to respond unless the form displays a currently valid OMB control number. | |||
Assured Guaranty [Cover Art to Follow] 2018 Annual Meeting of Shareholders and Proxy Statement
| DEAR SHAREHOLDERS: | March |
It is with great pleasure that we invite you to our 20182020 Annual General Meeting of shareholders on Wednesday, May 2, 2018,6, 2020, at 6 Bevis Marks in London. Whether or not you plan to attend the meeting in person, please vote your shares; your vote is important to us.
Assured Guaranty’s 20172019 financial performance was excellent. Our shareholders’ equity attributable to Assured Guaranty Ltd. per share,non-GAAP adjusted operating shareholder’s equity per share1andnon-GAAP adjusted book value per share1 all reached record levels, at $58.95, $56.20$71.18, $66.96 and $77.74,$96.86, respectively. These records reflectIn addition, we will look back on 2019 as the great stridesyear we continuedtook our first significant step to make onestablish our four main strategies:asset management business, Assured Investment Management, by acquiring BlueMountain Capital Management, LLC, which we refer to as BlueMountain, and associated entities.
Some of the highlights from our year include:
| • |
|
| • |
|
| • |
|
| • |
|
We provide further detail about our accomplishments and plans for the future in the Letter to Shareholders accompanying our 2017 Annual Report. We encourage you to review that letter and our 2017 Annual Report, as well as the Proxy Statement that follows this letter.
We look forward to another successful year.
Sincerely,
|
| |
|
|
| 1 |
|
| 2 | As reported by Creditflux for the fourth quarter of 2019. |
The market rewarded us for our accomplishments with a 30% total shareholder return for the year, double last year’s return. We provide further detail about our 2019 accomplishments and our plans for the future in the Letter to Shareholders accompanying our 2019 Annual Report, which we encourage you to review.
Finally, a word about the COVID-19 pandemic and its consequences. We offer our support and well wishes for the safety of all affected. Assured Guaranty is operating well remotely, as contemplated in the business continuity plan that we test regularly, and we are providing the services and communications we normally would. We believe the benefits of our value proposition are clearly evident in the volatile market environment we are now experiencing. We have the financial strength to fulfill our commitments, and preserving that financial strength is our highest strategic priority.
Sincerely,
|  | |
Francisco L. Borges | Dominic J. Frederico | |
| Chairman of the Board | President and Chief Executive Officer |
March 21, 201825, 2020
Assured Guaranty Ltd.
30 Woodbourne Avenue
Hamilton HM 08
Bermuda
NOTICE OF ANNUAL
GENERAL MEETING
TO THE SHAREHOLDERS OF ASSURED GUARANTY LTD.:
The Annual General Meeting of Assured Guaranty Ltd., which we refer to as AGL, will be held on Wednesday, May 2, 2018,6, 2020, at 8:1:00 a.m.p.m. London Time, at 6 Bevis Marks, London, EC3A 7BA, United Kingdom, for the following purposes:
| 1. | To elect our board of directors; |
| 2. | To approve, on an advisory basis, the compensation paid to AGL’s named executive officers; |
| 3. | To appoint PricewaterhouseCoopers LLP as AGL’s independent auditor for the fiscal year ending December 31, |
| 4. | To direct AGL to vote for directors of, and the appointment of the independent auditor for, its subsidiary Assured Guaranty Re Ltd.; and |
| 5. | To transact such other business, if any, as lawfully may be brought before the meeting. |
Shareholders of record are being mailed a Notice Regarding the Availability of Proxy Materials on or around March 21, 2018,25, 2020, which provides shareholdersthem with instructions on how to access the proxy materials and our 20172019 annual report on the Internet, and if they prefer, how to request paper copies of these materials. At this writing, the novel Coronavirus responsible forCOVID-19 continues to spread and governments are taking various actions in response. If we postpone or change the time or location of our Annual General Meeting, we will issue a press release that we will make available on our website atwww.assuredguaranty.com/annualmeeting and file with the Securities and Exchange Commission (which we refer to as the SEC) as definitive additional proxy material. If you wish to receive a physical copy of any such press release, please contact our Secretary at generalcounsel@agltd.com or (441)279-5725.
Only shareholders of record, as shown by the transfer books of AGL, at the close of business on March 8, 2018,13, 2020, are entitled to notice of, and to vote at, the Annual General Meeting.
SHAREHOLDERS OF RECORD MAY VOTE UP UNTIL 12:4:00 NOONP.M. EASTERN DAYLIGHT TIME ON MAY 1, 2018.5, 2020. BENEFICIAL OWNERS MUST SUBMIT THEIR VOTING INSTRUCTIONS SO THAT THEIR BROKERS WILL BE ABLE TO VOTE BY 11:59 P.M. EASTERN DAYLIGHT TIME ON April 30, 2018.MAY 4, 2020.
WHETHER OR NOT YOU PLAN TO ATTEND THE ANNUAL GENERAL MEETING IN PERSON AND REGARDLESS OF THE NUMBER OF SHARES YOU OWN, PLEASE VOTE AS PROMPTLY AS POSSIBLE VIA THE INTERNET OR BY TELEPHONE. ALTERNATIVELY, IF YOU HAVE REQUESTED WRITTEN PROXY MATERIALS, PLEASE SIGN, DATE AND RETURN THE PROXY CARD IN THE RETURN ENVELOPE PROVIDED AS PROMPTLY AS POSSIBLE. IF YOU LATER DESIRE TO REVOKE YOUR PROXY FOR ANY REASON, YOU MAY DO SO IN THE MANNER DESCRIBED IN THE ATTACHED PROXY STATEMENT. FOR FURTHER INFORMATION CONCERNING THE INDIVIDUALS NOMINATED AS DIRECTORS, THE PROPOSALS BEING VOTED UPON, USE OF THE PROXY AND OTHER RELATED MATTERS, YOU ARE URGED TO READ THE ATTACHED PROXY STATEMENT.
By Order of the Board of Directors,

Ling Chow
Secretary
|
|
| 1 | ||||
| 3 | ||||
| 3 | ||||
| 4 | ||||
| 5 | ||||
| 9 | ||||
Compensation Committee Interlocking and Insider Participation | ||||
| ||||
| INFORMATION ABOUT OUR COMMON SHARE OWNERSHIP | ||||
How Much Stock Is Owned By Directors and Executive Officers? | ||||
| 26 | ||||
| 43 | ||||
| 46 | ||||
| 47 | ||||
| EQUITY COMPENSATION PLANS INFORMATION | ||||
PROPOSALS CONCERNING OUR SUBSIDIARY, ASSURED GUARANTY RE LTD. | ||||
| SHAREHOLDER PROPOSALS FOR | ||||
How do I submit a proposal for inclusion in next year’s proxy material? | ||||
How do I submit a proposal or make a nomination at an Annual General Meeting? | ||||
| INFORMATION ABOUT THE ANNUAL GENERAL MEETING AND VOTING | ||||
PROXY STATEMENT
| Assured Guaranty Ltd. | March |
This summary highlights information contained elsewhere in this proxy statement and does not contain all of the information that you should consider before voting. For more complete information about the following topics, please review the complete proxy statement and the Annual Report onForm 10-K of Assured Guaranty Ltd. (which we refer to as AGL, we, us or our; we use Assured Guaranty, our Company or the Company to refer to AGL andtogether with its subsidiaries).
We intend to begin distribution of the Notice Regarding the Availability of Proxy Materials to shareholders on or about March 21, 2018.25, 2020.
ANNUAL GENERAL MEETING OF SHAREHOLDERS
| Time and Date | ||
| Place | 6 Bevis Marks London, EC3A 7BA United Kingdom | |
| Record Date | March | |
| Voting | Shareholders as of the record date are entitled to vote. Each Common Share is entitled to one vote for each director nominee and one vote for each of the proposals to be voted on. Shareholders of record may vote up until | |
Agenda Item | Board Vote Recommendation | Page Reference (for More Detail) | ||||||
Election of directors | For each director nominee | Page 12 | | |||||
Approval, on an advisory basis, of the compensation paid to AGL’s named executive officers | For | Page 67 | | |||||
Appointment of PricewaterhouseCoopers as AGL’s independent auditor for | For | Page 68 | | |||||
Direction of AGL to vote for directors of, and the appointment of the independent auditor of, AGL’s subsidiary, Assured Guaranty Re Ltd. | For each director nominee | Page 70 | |
We will also transact any other business that may properly come before the meeting.
At this writing, the novel Coronavirus responsible forCOVID-19 continues to spread and governments are taking various actions in response. If we postpone or change the time or location of our Annual General Meeting, we will issue a press release that we will make available on our website atwww.assuredguaranty.com/annualmeeting and file with the SEC as definitive additional proxy material. If you wish to receive a physical copy of any such press release, please contact our Secretary at generalcounsel@agltd.com or(441) 279-5725.
1
SUMMARY DIRECTOR INFORMATION
The following table provides summary information about each director nominee. Each director nominee will be elected for aone-year term by a majority of votes cast.
DIRECTOR SINCE | COMMITTEES | |||||||||||||||||||||||
| NOMINEE | AGE | PRINCIPAL OCCUPATION | A | C | F | NG | RO | E | ||||||||||||||||
| Francisco L. Borges | 66 | 2007 | Chairman, Landmark Partners, LLC | «
| «
| ||||||||||||||||||
| G. Lawrence Buhl | 71 | 2004 | Former Regional Director for Insurance Services, Ernst & Young LLP | «
| ✓
| ||||||||||||||||||
| Dominic J. Frederico | 65 | 2004 | President and Chief Executive Officer, Assured Guaranty Ltd. | ✓ | |||||||||||||||||||
| Bonnie L. Howard | 64 | 2012 | Former Chief Auditor and Global Head of Control and Emerging Risk, Citigroup | ✓
| «
| ||||||||||||||||||
| Thomas W. Jones | 68 | 2015 | Founder and Senior Partner of TWJ Capital, LLC | ✓ | ✓ | ||||||||||||||||||
| Patrick W. Kenny | 75 | 2004 | Former President and Chief Executive Officer, International Insurance Society | «
| ✓
| ✓
| |||||||||||||||||
| Alan J. Kreczko | 66 | 2015 | Former Executive Vice President and General Counsel of The Hartford Financial Services Group, Inc. | ✓ | ✓ | ||||||||||||||||||
| Simon W. Leathes | 70 | 2013 | Former independentnon-executive director of HSBC Bank plc | ✓ | ✓ | ✓ | |||||||||||||||||
| Michael T. O’Kane | 72 | 2005 | Former Senior Managing Director, Securities Division, TIAA CREF | ✓
| «
| ||||||||||||||||||
| Yukiko Omura | 62 | 2014 | Former Undersecretary General and Vice President/COO, International Fund for Agricultural Development | ✓ | ✓ | ||||||||||||||||||
| 2017 Meetings | 4 | 5 | 4 | 4 | 4 | 0 | ||||||||||||||||||
DIRECTOR |
COMMITTEES
| |||||||||||||||||||||||||
NOMINEE
| SINCE
| PRINCIPAL OCCUPATION
|
A
| C
| ES
| F
| NG
| RO
| E
| |||||||||||||||||
| Francisco L. Borges | 68 | 2007 | Chairman, Landmark Partners, LLC | ✓
| «
| «
| |||||||||||||||||||
| G. Lawrence Buhl | 73 | 2004 | Former Regional Director for Insurance Services, Ernst & Young LLP | «
| ✓
| ||||||||||||||||||||
| Dominic J. Frederico | 67 | 2004 | President and Chief Executive Officer, Assured Guaranty Ltd. | ✓ | |||||||||||||||||||||
| Bonnie L. Howard | 66 | 2012 | Former Chief Auditor and Global Head of Control and Emerging Risk, Citigroup | ✓
| «
| ||||||||||||||||||||
| Thomas W. Jones | 70 | 2015 | Founder and Senior Partner of TWJ Capital, LLC | ✓
| ✓
| ||||||||||||||||||||
| Patrick W. Kenny | 77 | 2004 | Former President and Chief Executive Officer, International Insurance Society | «
| ✓
| ✓
| ✓
| ||||||||||||||||||
| Alan J. Kreczko | 68 | 2015 | Former Executive Vice President and General Counsel of The Hartford Financial Services Group, Inc. | «
| ✓
| ✓
| |||||||||||||||||||
| Simon W. Leathes | 72 | 2013 | Former independentnon-executive director of HSBC Bank plc | ✓
| ✓
| ✓
| |||||||||||||||||||
| Michael T. O’Kane | 74 | 2005 | Former Senior Managing Director, Securities Division, TIAA CREF | ✓
| «
| ||||||||||||||||||||
| Yukiko Omura | 64 | 2014 | Former Undersecretary General and Vice President/COO, International Fund for Agricultural Development |
|
|
| ✓
|
| ✓
|
| |||||||||||||||
2019 Meetings | 4 | 5 | 2 1 | 4 | 4 | 4 | 0 | |||||||||||||||||||
| 1 | The Environmental and Social Responsibility Committee was establishedmid-year. |
A: Audit; C: Compensation; ES: Environmental and Social Responsibility; F: Finance; NG: Nominating and Governance; RO: Risk Oversight; E: Executive;Executive.
«: Chair;✓: Member
2
Our Board of Directors maintains strong corporate governance policies.
The Board and management have reviewed the rules of the Securities and Exchange Commission (which we refer to as the SEC)SEC and the New York Stock Exchange (which we refer to as the NYSE) listing standards regarding corporate governance policies and processes, and we are in compliance with the rules and listing standards.
We have adopted Corporate Governance Guidelines covering issues such as director qualification standards (including independence), director responsibilities, Board self-evaluations, and executive sessions of the Board.
Our Corporate Governance Guidelines contain our Categorical Standards for Director Independence.
We have adopted a Code of Conduct for our employees and directors and charters for each Board committee.
The full text of our Corporate Governance Guidelines, our Code of Conduct and each Board committee charter, are available on our website atwww.assuredguaranty.com/governance.governance. In addition, you may request copies of the Corporate Governance Guidelines, the Code of Conduct and the committee charters by contacting our Secretary via:
| Telephone | (441)279-5725 | |
| Facsimile | (441)279-5701 | |
| generalcounsel@agltd.com | ||
Our Board of Directors oversees our business and monitors the performance of management. The directors keep themselvesup-to-date on our Company by discussing matters with Mr. Frederico, who is our Chief Executive Officer (and whom we refer to as our CEO), other key executives and our principal external advisors, such as outside auditors, outside legal counsel, investment bankers and other consultants, by reading the reports and other materials that we send them regularly and by participating in Board and committee meetings.
The Board usually meets four times per year in regularly scheduled meetings, but will meet more often if necessary. During 2017,2019, the Board met fourfive times. All of our directors attended at least 75% of the aggregate number of meetings of the Board and committees of the Board of which they were a member held while they were in office during the year ended December 31, 2017.2019.
In February 2018,2020, our Board determined that, other than our CEO Mr. Frederico, all of our directors are independent under the listing standards of the NYSE. These independent directors constitute substantially more than a majority of our Board. In making its determination of independence, the Board applied its Categorical Standards for Director Independence and determined that no other material relationships existed between our Company and these directors. A copy of our Categorical Standards for Director Independence is available as part of our Corporate Governance Guidelines, which are available on our website atwww.assuredguaranty.com/governance.governance. In addition, as part of the independence determination, our Board monitors the independence of Audit and Compensation Committee members under rules of the SEC and NYSE listing standards that are applicable to members of the audit committee and compensation committees.committee.
As part of its independence determinations, the Board considered the other directorships held by the independent directors and determined that none of these directorships constituted a material relationship with our Company.
The independent directors meet at regularly scheduled executive sessions without the participation of management. The Chairman of the Board is the presiding director for executive sessions of independent directors.
OTHER CORPORATE GOVERNANCE HIGHLIGHTS
Our Board has a substantial majority of independent directors.
All members of the Audit, Compensation, Nominating and Governance, Finance, Environmental and Social Responsibility, and Risk Oversight Committees are independent directors.
3
Our Audit Committee recommends to the Board, which recommends to the shareholders, the annual appointment of our independent auditor. Each year our shareholders are asked to authorize the Board, acting through its Audit Committee, to determine the compensation of, and the scope of services performed by, our independent auditor. The Audit Committee also has the authority to retain outside advisors.
No member of our Audit Committee simultaneously serves on the audit committee of more than one other public company.
Our Compensation Committee has engaged a compensation consultant, Frederic W. Cook & Co., Inc., which we refer to as Cook, to assist it in evaluating the compensation of our CEO, based on corporate goals and objectives and, with the other independent directors, setting his compensation based on this evaluation. Cook has also assisted us in designing our executive compensation program. The Compensation Committee has conducted an assessment of Cook’s independence and has determined that Cook does not have any conflict of interest. Our Nominating and Governance Committee also engages Cook to assist it in evaluating the compensation of our Board of Directors.
We established an Executive Committee to exercise certain authority of the Board in the management of company affairs between regularly scheduled meetings of the Board when it is determined that a specified matter should not be postponed to the next scheduled meeting of the Board. Our Executive Committee did not meet in 2017.2019.
| • | We have adopted a Code of Conduct that sets forth basic principles to guide ourday-to-day activities. The Code of Conduct addresses, among other things, conflicts of interest, corporate opportunities, confidentiality, fair dealing, protection and proper use of company assets, compliance with laws and regulations, including insider trading laws, and reporting illegal or unethical behavior. The full text of our Code of Conduct is available on our website atwww.assuredguaranty.com/governance. |
In addition to AGL’s quarterly Board meetings, our Board has an annual business review meeting to assess specific areas of our Company’s operations and to learn about general trends affecting the financial guaranty industry.industry and asset management. We also provide our directors with the opportunity to attend continuing education programs.
We established an Environmental and Social Responsibility Committee in May 2019, and it began meeting in August 2019. Prior to the establishment of the Environmental and Social Responsibility Committee, our Nominating and Governance Committee was responsible for many such matters.
| • | We adopted an Environmental Policy and a Statement on Climate Change in February 2019 and, in February 2020, we adopted a Human Rights Statement. The current versions of these statements are available on our website at www.assuredguaranty.com/governance. |
In early 2020, we sought to engage with our shareholders with respect to environmental and social matters, which we refer to as E&S matters, and contacted holders of 31.9% of our outstanding Common Shares (which comprised every shareholder holding more than 5% of our outstanding Common Shares) and offered to discuss such matters. Holders of approximately 22% of our outstanding Common Shares provided us with specific feedback on E&S matters and our E&S disclosure.
In accordance with its charter, the Nominating and Governance Committee identifies potential nominees for directors from various sources. The Nominating and Governance Committee:
Reviews the qualifications of potential nominees to determine whether they might be good candidates for Board of Directors membership
Reviews the potential nominees’ judgment, experience, independence, understanding of our business or other related industries and such other factors as it determines are relevant in light of the needs of the Board of Directors and our Company
Selects qualified candidates and reviews its recommendations with the Board of Directors, which will decide whether to nominate the person for election to the Board of Directors at an Annual General Meeting of Shareholders (which we refer to as an Annual General Meeting). Between Annual General Meetings, the Board, upon the recommendation of the Nominating and Governance Committee, can fill vacancies on the Board by appointing a director to serve until the next Annual General MeetingMeeting.
The Nominating and Governance Committee has the authority to retain search firms to be used to identify director candidates and to approve the search firm’s fees and other retention terms. The Nominating and Governance Committee may also retain other advisors.
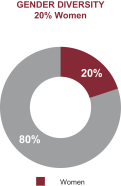
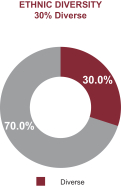
We believe that diversity among members of the Board is an important consideration and is critical to the Board’s ability to perform its duties and various roles. Accordingly, in recommending nominees, the Board considers a wide range of individual perspectives and backgrounds in addition to diversity in professional experience and training. Our Board is currently composed of individuals from different disciplines, including lawyers, accountants and individuals who have industry, finance, executive and international experience, and is composed of both men and women and citizens of the United States, the United Kingdom and Japan. Our Corporate Governance Guidelines address diversity of experience, requiring the Nominating and Governance Committee to review annually the
4
skills and attributes of Board members within the context of the currentmake-up of the full Board. Our Corporate Governance Guidelines also provide that Board members should have individual backgrounds that, when combined, provide a portfolio of experience and knowledge that will serve our governance and strategic needs. The Nominating and Governance Committee will consider Board candidates on the basis of a range of criteria, including broad-based business knowledge and contacts, prominence and sound reputation in their fields as well as having a global business perspective and commitment to good corporate citizenship. Our Corporate Governance Guidelines specify that directors should represent all shareholders and not any special interest group or constituency. The Nominating and Governance Committee annually reviews its own performance. In connection with such evaluation, the Nominating and Governance Committee assesses whether it effectively nominates candidates for director in accordance with the above described standards specified by the Corporate Governance Guidelines. See each nominee’s biography appearing later in this proxy statement for a description of the specific experience that each such individual brings to our Board.
Our Corporate Governance Guidelines additionally specify that directors should be able and prepared to provide wise and thoughtful counsel to top management on the full range of potential issues facing us. Directors must possess the highest personal and professional integrity. Directors must have the time necessary to fully meet their duty of due care to the shareholders and be willing to commit to service over the long term.
4
The Nominating and Governance Committee will consider a shareholder’s recommendation for director but has no obligation to recommend such candidatescandidate for nomination by the Board of Directors. Assuming that appropriate biographical and background material is provided for candidates recommended by shareholders, the Nominating and Governance Committee will evaluate those candidates by following substantially the same process and applying substantially the same criteria as for candidates recommended by other sources. If a shareholder has a suggestion for candidatesa candidate for election, the shareholder should send it to: Secretary, Assured Guaranty Ltd., 30 Woodbourne Avenue, Hamilton HM 08, Bermuda. No person recommended by a shareholder will become a nominee for director and be included in a proxy statement unless the Nominating and Governance Committee recommends, and the Board approves, such person.
If a shareholder desires to nominate a person for election as director at an Annual General Meeting, that shareholder must comply with Article 14 of AGL’sBye-Laws, which requires notice no later than 90 days prior to the anniversary date of the immediately preceding Annual General Meeting. This time period has passed with respect to the 20182020 Annual General Meeting. With respect to the 20192021 Annual General Meeting, AGL must receive such written notice on or prior to February 1, 2019.5, 2021. Such notice must describe the nomination in sufficient detail to be summarized on the agenda for the meeting and must set forth:
the shareholder’s name as it appears in AGL’s books
a representation that the shareholder is a record holder of AGL’s shares and intends to appear in person or by proxy at the meeting to present such proposal
the class and number of shares beneficially owned by the shareholder
the name and address of any person to be nominated
a description of all arrangements or understandings between the shareholder and each nominee and any other person or persons, naming such other person or persons, pursuant to which the nomination or nominations are to be made by the shareholder
such other information regarding each nominee proposed by such shareholder as would be required to be included in a proxy statement filed pursuant to the SEC’s proxy regulations
the consent of each nominee to serve as a director of AGL, if so elected
The Board of Directors has established an Audit Committee, a Compensation Committee, an Environmental and Social Responsibility Committee, a Finance Committee, a Nominating and Governance Committee, a Risk Oversight Committee and an Executive Committee. All of the Board committees other than the Executive Committee are composed entirely of directors who are independent of our Company and management, as defined by the NYSE listing standards and as applied by the Board.
| The Audit Committee | Chairman: G. Lawrence Buhl / 4 meetings during | |
Other Audit Committee members: Bonnie L. Howard, Thomas W. Jones, | ||
The Audit Committee provides oversight of the integrity of our Company’s financial statements and financial reporting process, our compliance with legal and regulatory requirements (including cybersecurity requirements), the system of internal controls, the audit process, the performance of our internal audit program and the performance, qualification and independence of the independent
5
auditor. The Audit Committee is also responsible for the oversight of Company risks related to (i) financial reporting, accounting policies and reserving, (ii) legal, regulatory and compliance matters, (iii) information technology (including cybersecurity), (iv) workouts, emerging events, and counterparties, (v) outsourcing and people, and (vi) business continuity planning.
The Audit Committee is composed entirely of directors who are independent of our Company and management, as defined by the NYSE listing standards.standards and as applied by the Board.
The Board has determined that each member of the Audit Committee satisfies the financial literacy requirements of the NYSE and except for Mr. Kreczko, is an audit committee financial expert, as that term is defined under Item 407(d) of the SEC’sRegulation S-K. For additional information about the qualifications of the Audit Committee members, see their respective biographies set forth in “Proposal No. 1: Election of Directors.”
| The Compensation Committee | Chairman: Patrick W. Kenny / | |
Other Compensation Committee members: G. Lawrence Buhl, Jones | ||
The Compensation Committee has responsibility for evaluating the performance of our CEO and senior management and determining executive compensation in conjunction with the independent directors. The Compensation Committee also works with the Nominating and Governance Committee and our CEO on succession planning. The Compensation Committee is also responsible for the oversight of Company risks related to people, succession planning and compensation.
The Compensation Committee is composed entirely of directors who are independent of our Company and management, as defined by the NYSE listing standards.standards and as applied by the Board.
The Compensation Committee’s meetings included discussions with Cook to review executive compensation trends and peercomparison group compensation data and to evaluate the risk of our executive compensation program.
5
| Environmental and Social Responsibility Committee | Chairman: Alan J. Kreczko / 2 meetings during 2019 | |
Other Environmental and Social Responsibility Committee members: Francisco L. Borges and Patrick J. Kenny | ||
The Environmental and Social Responsibility Committee provides oversight and review of the Company’s significant strategies, policies and practices regarding environmental and social responsibilities. The Environmental and Social Responsibility Committee focuses on four principal subject areas: (i) environmental stewardship, including risks and opportunities posed by environmental issues; (ii) corporate social responsibility, including community engagement and corporate philanthropy; (iii) workforce equality and wellness, including diversity and inclusion; and (iv) stakeholder engagement. The Environmental and Social Committee was established after the May 2019 Board meeting and met in both of the succeeding quarters, in August and November 2019. Prior to the establishment of the Environmental and Social Responsibility Committee, the Nominating and Governance Committee was responsible for many such matters.
| The Finance Committee | Chairman: Michael T. O’Kane / 4 meetings during | |
Other Finance Committee members: | ||
The Finance Committee of the Board of Directors oversees management’s investment of our Company’s investment portfolio, including in alternative investments.investments, and is responsible for oversight of Company risks related to capital, liquidity, investments, financial market conditions, foreign currency, and rating agencies. The Finance Committee also oversees, and makes recommendations to the Board with respect to, our capital structure, dividends, financing arrangements, investment guidelines, potential alternative investments and any corporate development activities.
| The Nominating and Governance Committee | Chairman: Francisco Borges / 4 meetings during | |
Other Nominating and Governance Committee members: | ||
The responsibilities of the Nominating and Governance Committee include identifying individuals qualified to become Board members, recommending director nominees to the Board and developing and recommending corporate governance guidelines.guidelines, as well as the oversight of Company risks related to board qualification, corporate structure, governance, regulatory compliance and people. The Nominating and Governance Committee also has responsibility to review and make recommendations to the full Board regarding director compensation. In addition to general corporate governance matters, the Nominating and Governance Committee assists the Board and the Board committees in their self-evaluations. The Nominating and Governance Committee is composed entirely of directors who are independent of our Company and management, as defined by the NYSE listing standards.standards and as applied by the Board.
6
| The Risk Oversight Committee | Chairman: Bonnie L. Howard / 4 meetings during | |
Other Risk Oversight Committee members: Simon W. Leathes, Yukiko Omura | ||
The Risk Oversight Committee oversees management’s establishment and implementation of standards, controls, limits, guidelines and policies relating to risk appetite, risk assessment and enterprise risk management. The Risk Oversight Committee focuses on both the underwriting, surveillance and surveillanceworkout of credit risks andas well as the assessment, management and managementoversight of other Company enterprise risks, including, but not limited to, financial, legal, operational (including cybersecurity)information technology, cybersecurity and vendor management) and other risks concerning our Company’s governance, reputation and ethical standards.
| The Executive Committee | Chairman: Francisco L. Borges / | |
Other Executive Committee members: Dominic J. Frederico, Patrick W. Kenny, Simon W. Leathes | ||
The Executive Committee was established to have, and to exercise, certain of the powers and authority of the Board in the management of the business and affairs of our Company between regularly scheduled meetings of the Board when, in the opinion of a quorum of the Executive Committee, a matter should not be postponed to the next scheduled meeting of the Board. The Executive Committee’s authority to act is limited by our Company’sBye-Laws, rules of the NYSE and applicable law and regulation and the Committee’s charter.
HOW ARE DIRECTORS COMPENSATED?
In 2017, our Nominating and Governance Committee engaged Cook to conduct a comprehensive review and assessment of our independent director compensation program. Cook reviews this program periodically. Cook evaluated the director compensation by comparing it against the compensation awarded to directors of companies in our executive compensation comparison group. (The compensation comparison group is discussed below under “Compensation Discussion and Analysis–Compensation Governance–Executive Compensation Comparison Group”.) Cook also looked at a broader market segment using data from Cook’s report regarding compensation packages for public companyOur independent directors for 2016, the most recent year for which information was available. Cook again found that the structure of our director compensation program was generally consistent with peer group policies and best practice design as recognized by the proxy advisory firms and investors, noting:
6
Cook found that the percentage of our independent director compensation paid in equity was below the median of the comparison group practice of 61%, while the retainer for thenon-executive Chairman was at the 25th percentile of the comparison group practice. Cook recommended that thenon-executive Chairman retainer should be reviewed for reasonableness and appropriateness in light of the strategic importance of the position to our Company, the skill set and experience of the Chairman, and the expected time commitment.
After considering Cook’s market data, analysis and recommendations, the Nominating and Governance Committee made two changes to the independent director compensation in light of the expanding scope of the Company’s business as well as the time commitment associated with attending Board meetings in the U.K. The Nominating and Governance Committee increased the equity portion of thereceive an annual retainer of our independent directors by $25,000.$265,000 per year. We now pay $145,000 of the retainer in restricted stock and $120,000 of the retainer in cash, for a total annual retainer of $265,000. The Nominating and Governance Committee also increased the annual retainer paid to thenon-executive Chairman, which had not been increased for several years and, as a result, was at the 25th percentile of the peer group practice. In 2017, the Chairman’s annual retainer was increased from $125,000 to $225,000.cash. A director also may elect to receive any or all of the cash portion of his or her entire annual retainer (plus the additional cash amounts described below) in restricted stock.
The restricted stock vests on the day immediately prior to the next Annual General Meeting following the grant of the stock. However, if, prior to such vesting date, either (i) a change in control (as defined in the Assured Guaranty Ltd. 2004 Long-Term Incentive Plan, as amended) of Assured Guaranty Ltd. occurs before the director terminates service on the Board or (ii) the director terminates service on the Board as a result of such director’s death or disability, then the restricted stock will vest on the date of such change in control or the date of the director’s termination of service, whichever is applicable. Grants of restricted stock receive cash dividends and have voting rights; the cash dividends accrue during the vesting period and are paid upon vesting.
In addition to the annual retainers described above:
The Company generally will not pay a fee for attendance at Board or committee meetings, although the Chairman of the Board has the discretion to pay attendance fees of $2,000 for extraordinary or special meetings. There were no extraordinary or special meetings of the Board in 2017. We do not pay a fee for being a member, or attending meetings, of the Executive Committee.
In addition to the annual retainers paid to independent directors, Cook also reviewed the director stock ownership requirements. Cook noted that because the director stock ownership guidelines are expressed as the greater of 25,000 shares or a multiple of the cash portion of thenon-employee director retainer, the dollar value of the ownership requirement fluctuates based on changes in our Company’s stock price until the ownership guideline is met. Cook found that the ownership requirement expressed as a multiple of the cash retainer and as a dollar value is above the 75th percentile of the peer group practice, and above the ISS best practice of five times the current annual cash retainer. Cook suggested the Nominating and Governance Committee consider moving to a guideline of five times the current annual cash retainer with no minimum share ownership requirement. The Nominating and Governance Committee considered Cook’s suggestion and increased the share ownership guidelines to five times the current cash annual retainer to be consistent with best practices but did not eliminate the 25,000 share ownership component since doing so would reduce the share ownership guideline.
As recently revised, ourOur share ownership guidelines require that, each independent director own the greater of (i) at least 25,000 Common Shares or (ii) Common Shares with a market value of at least five times the maximum cash portion of the annual director retainer, before being permitted to dispose of any shares acquired as compensation from our Company.Company, each independent director own Common Shares with a market value of at least $600,000, which amount is five times the maximum cash portion of the annual director retainer (exclusive of committee fees). (Prior to May 2019 the minimum was the greater of that amount or 25,000 shares.) Once a director has reached the share ownership guideline, for so long as he or she serves on the Board, such director may not dispose of any Common Shares if such disposition would cause the director to be below the share ownership guideline. Common Shares that had been restricted but subsequently vested and purchased Common Shares count toward the share ownership guideline. Our four longest servingSeven independent directors meet our share ownership guidelines. Our five newer Board members (Ms. Howard, who joined the Board in August 2012; Mr.Two independent directors (Mr. Leathes, who joined the Board in May 2013;2013 and Ms. Omura, who joined the Board in May 2014; and Messrs. Jones and Kreczko, who joined the Board in August 2015)2014) are accumulating Common Shares toward their ownership goals.
In addition to the annual retainer described above:
Thenon-executive Chairman of the Board receives an annual retainer of $225,000 in recognition of the strategic role he plays and the time commitment involved. The Chairman of the Board has elected not to receive any fees for serving as a member or chair of a board committee.
The Chairman of each committee of the Board other than the Executive Committee receives an additional $30,000 annual retainer.
Members, other than the chairman of the committee, of each committee of the Board other than the Executive Committee receive an additional $15,000 annual retainer.
The Company generally will not pay a fee for attendance at Board or committee meetings, although the Chairman of the Board has the discretion to pay attendance fees of $2,000 for extraordinary or special meetings. There was one extraordinary meeting of the Board in 2019 (to consider our acquisition of BlueMountain), but no attendance fee was paid for attendance at that meeting. We do not pay a fee for being a member, or attending meetings, of the Executive Committee.
In 2019, our Nominating and Governance Committee engaged Cook to conduct a comprehensive review and assessment of our independent director compensation program. Cook reviews this program periodically. Cook evaluated our director compensation by comparing it against the compensation awarded to directors of companies in our executive compensation comparison group as
7
constituted before the addition of the four new companies as described under “Compensation Discussion and Analysis—Compensation Governance—Executive Compensation Comparison Group” on page 48 below, and which we refer to as the prior executive compensation comparison group. Cook also looked at a broader market segment using data from Cook’s report for compensation packages for public company independent directors for 2018, the most recent year for which such information was available. Cook found that the structure of our director compensation program was generally consistent with prior executive compensation comparison group policy and best practice design as recognized by the proxy advisory firms and investors, noting:
the absence of meeting fees to simplify program administration and avoid the implication that there is additional pay for meeting attendance, which is an expected part of Board service
the use of committee member retainers to differentiate compensation among directors based on workload
the vesting of annual restricted stock awards over aone-year period, which protects against the possibility of director entrenchment
the payment of additional retainers to the board and committee leadership to recognize the additional responsibilities and time commitment associated with these roles
our limited benefits (we provide a Company match of up to $15,000 per director for contributions to charitable organizations of the director’s choice)
a meaningful and robust stock ownership guideline
No changes were made to our independent director compensation program in 2019, although the director share ownership guideline was simplified pursuant to a recommendation from Cook. Cook observed that, with the increase of our stock price over the years, that portion of our independent stock ownership guideline requiring ownership of 25,000 common shares had the effect of increasing materially the dollar value of the requirement and was volatile, while the other portion of our guideline requiring ownership of common shares with a market value of at least five times the maximum cash portion of the annual director retainer was itself higher than the 75th percentile of prior executive compensation comparison group practice and consistent with the best practice identified by a major proxy advisory firm. Consequently, Cook recommended amending the guideline to remove the 25,000 common share floor, and we did so.
Cook found that the aggregate cost of our independent director compensation program approximates the 75th percentile of our prior executive compensation comparison group. Cook also found that, before considering the instances where our directors have chosen to receive a portion of their cash compensation in our common shares, our total per director compensation has a somewhat heavier weighting on cash compensation than that of our prior executive compensation comparison group.
DIRECTOR COMPENSATION
The following table sets forth our 20172019 independent director compensation, including the compensation for the directors’ committee assignments as of such date.
| Name | Fees Earned or Paid in Cash | Stock Awards(1) | All Other Compensation(2) | Total | Fees Earned or Paid in Cash | Stock Awards(1) | All Other Compensation(2) | Total | ||||||||||||||||||||||||
Francisco L. Borges(3)
|
|
$345,000
|
|
|
$145,000
|
|
|
$16,059
|
|
$
|
506,059
|
|
| $345,000 |
|
| $145,000 |
|
| $33,014 |
| $ | 523,014 |
| ||||||||
G. Lawrence Buhl
|
|
$165,000
|
|
|
$145,000
|
|
|
$26,382
|
|
$
|
336,382
|
|
| $165,000 |
|
| $145,000 |
|
| $30,883 |
| $ | 340,883 |
| ||||||||
Bonnie L. Howard
|
|
$165,000
|
|
|
$145,000
|
|
|
$16,118
|
|
$
|
326,118
|
|
| $165,000 |
|
| $145,000 |
|
| $21,503 |
| $ | 331,503 |
| ||||||||
Thomas W. Jones
|
|
$150,000
|
|
|
$145,000
|
|
|
$31,570
|
|
$
|
326,570
|
|
| $150,000 |
|
| $145,000 |
|
| $25,665 |
| $ | 320,665 |
| ||||||||
Patrick W. Kenny(4)
|
|
$165,000
|
|
|
$145,000
|
|
|
$23,838
|
|
$
|
333,838
|
|
| $180,000 |
|
| $145,000 |
|
| $29,747 |
| $ | 354,747 |
| ||||||||
Alan J. Kreczko(5)
|
|
$150,000
|
|
|
$145,000
|
|
|
$23,835
|
|
$
|
318,835
|
|
| $180,000 |
|
| $145,000 |
|
| $27,143 |
| $ | 352,143 |
| ||||||||
Simon W. Leathes(6)
|
|
$239,457
|
|
|
$145,000
|
|
|
$675
|
|
$
|
385,132
|
|
| $272,725 |
|
| $145,000 |
|
| $ 929 |
| $ | 418,654 |
| ||||||||
Michael T. O’Kane
|
|
$165,000
|
|
|
$145,000
|
|
|
$8,806
|
|
$
|
318,806
|
|
| $165,000 |
|
| $145,000 |
|
| $12,654 |
| $ | 322,654 |
| ||||||||
Yukiko Omura
|
|
$150,000
|
|
|
$145,000
|
|
|
—
|
|
$
|
295,000
|
|
| $150,000 |
|
| $145,000 |
|
| — |
| $ | 295,000 |
| ||||||||
| (1) | Represents grant date fair value, rounded to the nearest $1,000. |
| (2) | Other compensation consists of matching gift donations to eligible charities paid in |
| (3) | Mr. Borges agreed to forgo an additional fee as the Chairman of the Nominating and Governance Committee due to the substantial overlap between that position and his position as the Chairman of the |
8
| (4) | Mr. Kenny elected to receive |
| (5) | Mr. Kreczko elected to receive the entire cash component of his compensation as restricted stock. |
| (6) | The fees for Mr. Leathes include |
The following table shows information related to independent director equity awards outstanding on December 31, 2017:2019:
| Name | Unvested Restricted Stock(1) | Vested Stock Options | Unvested Restricted Stock(1) | Vested Stock Options | ||||||||||||
Francisco L. Borges
|
|
12,919
|
|
|
7,658
|
| 10,657 | 7,658 | ||||||||
G. Lawrence Buhl
|
|
3,823
|
|
|
7,026
|
| 3,154 | 3,153 | ||||||||
Bonnie L. Howard
|
|
3,823
|
|
|
—
|
| 3,154 | — | ||||||||
Thomas W. Jones
|
|
3,823
|
|
|
—
|
| 3,154 | — | ||||||||
Patrick W. Kenny
|
|
6,591
|
|
|
13,561
|
| 3,806 | 4,955 | ||||||||
Alan J. Kreczko
|
|
7,777
|
|
|
—
|
| 7,068 | — | ||||||||
Simon W. Leathes
|
|
3,823
|
|
|
—
|
| 3,154 | — | ||||||||
Michael T. O’Kane
|
|
3,823
|
|
|
7,026
|
| 3,154 | 3,153 | ||||||||
Yukiko Omura
|
|
3,823
|
|
|
—
|
| 3,154 | — | ||||||||
| (1) | Vests one day prior to the |
WHAT IS OUR BOARD LEADERSHIP STRUCTURE?
Our current Chairman of the Board is Francisco L. Borges. The position of CEO is held by Dominic Frederico.
While the Board has no fixed policy with respect to combining or separating the offices of Chairman of the Board and CEO, those two positions have been held by separate individuals since our 2004 initial public offering. We believe this is the appropriate leadership
8
structure for us at this time. Mr. Borges and Mr. Frederico have had an excellent working relationship, which has continued to permit Mr. Frederico to focus on running our business and Mr. Borges to focus on Board matters, including oversight of our management. Mr. Borges and Mr. Frederico collaborate on setting agendas for Board meetings to be sure that the Board discusses the topics necessary for its oversight of the management and affairs of our Company. As Chairman of the Board, Mr. Borges sets the final Board agenda and chairs Board meetings, including executive sessions at which neither our CEO nor any other member of management is present. The Chairman of the Board also chairs our Annual General Meetings.
HOW DOES THE BOARD OVERSEE RISK?
The Board’s role in risk oversight is consistent with our leadership structure, with our CEO and other members of senior management having responsibility for assessing and managing risk exposure and the Board and its committees providing oversight in connection with these activities. Our Company’s policies and procedures relating to risk assessment and risk management are overseen by our Board. The Board takes an enterprise-wide approach to risk management that is designed to support our business plans at a reasonable level of risk. A fundamental part of risk assessment and risk management is not only understanding the risks a company faces and what steps management is taking to manage those risks, but also understanding what level of risk is appropriate for us. The Board annually approves our business plan, factoring risk management into account. The involvement of the Board in setting our business strategy is a key part of its assessment of management’s risk tolerance and also a determination of what constitutes an appropriate level of risk for us.
While the Board of Directors has the ultimate oversight responsibility for the risk management process, various committees of the Board also have responsibility for risk assessment and risk management. As discussed under “Committees of the Board,” the Board has created a Risk Oversight Committee that oversees the standards, controls, limits, guidelines and policies that our Company establishes and implements in respect of credit underwriting and risk management. It focuses on management’s assessment and management of both (i) credit risks and (ii) other enterprise risks, including, but not limited to, financial, legal and operational risks (including cybersecurity risks), and risks relating to our reputation and ethical standards. Our Risk Oversight Committee and Board pay particular attention to credit risks we assume when we issue financial guaranties or engage in strategic transactions.transactions and to risks related to Assured Investment Management. In addition, the Audit Committee of the Board of Directors is responsible for reviewing policies and
9
processes related to the evaluation of risk assessment and risk management, including our major financial risk exposures and the steps management has taken to monitor and control such exposures. It also oversees cybersecurity risks and reviews compliance with legal and regulatory requirements. The Finance Committee of the Board of Directors oversees the investment of the Company’s investment portfolio (including alternative investments) and the Company’s capital structure, financing arrangements and any corporate development activities in support of the Company’s financial plan. The Nominating and Governance Committee of the Board of Directors oversees risk at the Company by developing appropriate corporate governance guidelines and identifying qualified individuals to become board members. The Environmental and Social Responsibility Committee oversees risks related to the environment, sustainability and social responsibility, while each of the other Board committees have responsibility for risk assessment of such risks to the extent within their purview.
As part of its oversight of executive compensation, the Compensation Committee reviews compensation risk. The Compensation Committee oversaw the performance of a risk assessment of our employee compensation program to determine whether any of the risks arising from our compensation program are reasonably likely to have a material adverse effect on us. Since January 2011, the Compensation Committee has retained Cook to perform an annual review of each of our compensation plans and identify areas of risk and the extent of such risk. The Compensation Committee directs that our Chief Risk Officer work with Cook to perform such risk assessment and to be sure that compensation risk is included in our enterprise risk management system. In conducting this assessment, fromtime-to-time, most recently in February 2019, Cook performs a comprehensive systemic, qualitative review of all of our incentive compensation programs and reviews its findings with our Chief Risk Officer for completeness and accuracy. Cook seeks to identify any general areas of risk or potential for unintended consequences that exist in the design of our compensation programs and to evaluate our incentive plans relative to our enterprise risks to identify potential areas of concern, if any.
Cook undertook a compensation risk assessment update most recently in February 20182020 and concluded that our incentive plans, including the changes we made for 2020, are well-aligned with sound compensation design principles and do not encourage behaviors that would create material risk for our Company. Our Chief Risk Officer reviewed their findings and agreed with their conclusion. Based on this update, the Compensation Committee continued to find that there is an appropriate balance between the risks inherent in our business and our compensation program.
COMPENSATION COMMITTEE INTERLOCKING AND INSIDER PARTICIPATION
The Compensation Committee of our Board of Directors has responsibility for determining the compensation of our executive officers. None of the members of the Compensation Committee is a current or former officer or employee of our Company. No executive officer of our Company serves on the compensation committee of any company that employs any member of the Compensation Committee.
WHAT IS OUR RELATED PERSON TRANSACTIONS APPROVAL POLICY AND WHAT PROCEDURES DO WE USE TO IMPLEMENT IT?
Through our committee charters, we have established review and approval policies for transactions involving our Company and related persons, with the Nominating and Governance Committee taking the primary approval responsibility for transactions with our executive officers and directors and the Audit Committee taking the primary approval responsibility for transactions with 5% shareholders. No member of these committees who has an interest in a transaction being reviewed is allowed to participate in any decision regarding any such transaction.
9
Our Nominating and Governance Committee charter requires the Nominating and Governance Committee to review and approve or disapprove all proposed transactions with executive officers and directors that, if entered into, would be required to be disclosed pursuant to Item 404 ofRegulation S-K, the SEC provision which requires disclosure of any related person transaction with our Company that exceeds $120,000 per fiscal year. The Nominating and Governance Committee must also review reports, which our General Counsel provides periodically, and not less often than annually, regarding transactions with executive officers and directors (other than compensation) that have resulted, or could result, in expenditures thateven if they are not required to be disclosed pursuant to Item 404 ofRegulation S-K.
Our Audit Committee charter requires our Audit Committee to review and approve or disapprove all proposed transactions with any person owning more than 5% of any class of our voting securities that, if entered into, would be required to be disclosed pursuant to Item 404 ofRegulation S-K. In addition, our Audit Committee charter requires the Audit Committee to review reports regarding such transactions, which our General Counsel provides to the Audit Committee periodically, and not less often than annually, regarding transactions with any persons owning more than 5% of any class of the voting securities of AGL that have resulted, or could result, in expenditures thateven if they are not required to be disclosed pursuant to Item 404 ofRegulation S-K. Our Audit Committee charter also requires the Audit Committee to review other reports and disclosures of insider and affiliated party transactions which our General Counsel provides periodically, and not less often than annually.
10
Our General Counsel identifies related partyperson transactions requiring committee review pursuant to our committee charters from transactions that are:
disclosed in director and officer questionnaires (which must also be completed by nominees for director) or in certifications of Code of Conduct compliance
reported directly by the related person or by another employee of our Company
identified by our Chief Financial Officervendor management procedures based on comparison of vendors against a list of directors, executive officers and known 5% shareholders and certain of their related persons
If we have a related person transaction that requires committee approval in accordance with the policies set forth in our committee charters, we either seek that approval before we enter into the transaction or, if that timing is not practical, we ask the appropriate committee to ratify the transaction.
WHAT RELATED PERSON TRANSACTIONS DO WE HAVE?
From time to time, institutional investors, such as large investment management firms, mutual fund management organizations and other financial organizations become beneficial owners (through aggregation of holdings of their affiliates) of 5% or more of a class of our voting securities and, as a result, are considered “related persons” under the SEC’s rules. These organizations may provide services to us. In 2017,2019, the following transactions occurred with investors who reported beneficial ownership of 5% or more of our voting securities.
As indicated in “Which Shareholders Own More Than 5% of Our Common Shares,” Wellington Management Group LLP, which we refer to as Wellington Management, and BlackRock, Inc., which we refer to as BlackRock, own approximately 8.25%8.48% and 5.18%5.67% of AGL’s Common Shares outstanding, respectively, as of March 8, 2018,13, 2020 (the record date for our Annual General Meeting), based on the amount of Common Shares they reported in their Schedule 13G filings.filings as of the date set forth in such filing, and on the amount of Common Shares outstanding as of the record date. We appointed both Wellington Management and BlackRock as investment managers to manage certain of our investment accounts prior to their reaching such ownership thresholds. As of December 31, 2017,2019, Wellington Management managed approximately $2.3$1.95 billion of our investment assets, which is approximately 20%19% of our total fixed maturity and short-term investment portfolio, and BlackRock managed approximately $2.4$2.2 billion of our investment assets, which is approximately 21%22% of our total fixed maturity and short-term investment portfolio. In 2017,2019, we incurred expenses of approximately $1.8$1.7 million related to our investment management agreement with Wellington Management and $2.3$1.9 million with respect to our investment management and investment reporting agreements with BlackRock.
In addition, as previously disclosed, we repurchased 297,131 common shares fromFrom time to time, certain officers, directors, employees, their family members and related charitable foundations may make investments in various private funds, vehicles or accounts managed by our CEO and 23,062 common shares from our then General Counsel on January 6, 2017 at a per share price equalCompany. These investments are available to $38.73, the closing price of onethose of our Common Shares onCompany’s employees whom we have determined to have a status that reasonably permits us to offer them these types of investments in compliance with applicable laws. Generally, these investments are not subject to the New York Stock Exchange on such date, withmanagement fees and performance allocations or incentive fees charged to other investors. Andrew Feldstein, our CEO receiving aggregate proceedsChief Investment Officer and Head of $11,507,883.63 andAsset Management, is among our then General Counsel receiving aggregate proceeds of $893,191.26 from such repurchases. Our CEO and then General Counsel also separately received 297,131 and 23,062 Common Shares, respectively, on January 6, 2017employees who invest in settlement of 297,131 share units and 23,062 share units which such officers held in the employer stock fund of the Assured Guaranty Ltd. Supplemental Employee Retirement Plan that were required to be distributed in January 2017 to comply with requirements of Sections 409A and 457A of the Internal Revenue Code of 1986, as amended.various private funds, vehicles or accounts managed by our Company.
DID OUR INSIDERS COMPLY WITHDELINQUENT SECTION 16(A) BENEFICIAL OWNERSHIP REPORTING IN 2017?REPORTS
Our executive officers and directors are subject to the reporting requirements of Section 16 of the Securities Exchange Act of 1934, as amended, which we refer to as the Exchange Act. We believe that all of our executive officers and directors complied with all filing requirements imposed by Section 16(a) of the Exchange Act on a timely basis during fiscal year 2017.2019.
1011
PROPOSAL NO. 1:ELECTION OF DIRECTORS
GENERAL
OurBye-Laws provide for a maximum of 21 directors and empower our Board of Directors to fix the exact number of directors and appoint persons to fill any vacancies on the Board until the next Annual General Meeting. The Board may appoint any person as a director to fill a vacancy on the Board occurring as the result of any existing director being removed from office pursuant to theBye-Laws or prohibited from being director by law; being or becoming bankrupt or making any arrangement or composition with his or her creditors generally; being or becoming disqualified, of unsound mind, or dying; or resigning. The Board may also appoint a person as a director to fill a vacancy resulting from an increase in the size of the Board or a vacancy left unfilled at an Annual General Meeting.
Our Board currently consists of 10 members. Following the recommendation of the Nominating and Governance Committee, our Board of Directors has nominated Francisco L. Borges, G. Lawrence Buhl, Dominic J. Frederico, Bonnie L. Howard, Thomas W. Jones, Patrick W. Kenny, Alan J. Kreczko, Simon W. Leathes, Michael T. O’Kane and Yukiko Omura as directors of AGL. Proposal No. 1 is Item 1 on the proxy card.
Our directors are elected annually to serve until their respective successors shall have been elected.
 | The board of directors recommends that you vote “FOR” the election of the nominees as directors of AGL. |
It is the intention of the persons named as proxies, subject to any direction to the contrary, to vote in favor of the candidates nominated by the Board of Directors. We know of no reason why any nominee may be unable to serve as a director. If any nominee is unable to serve, your proxy may vote for another nominee proposed by the Board, or the Board may reduce the number of directors to be elected.
We have set forth below information with respect to the nominees for election as directors. There are no arrangements or understandings between any director and any other person pursuant to which any director was or is selected as a director or nominee.
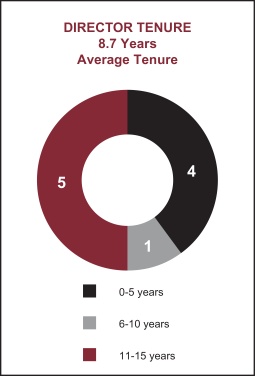
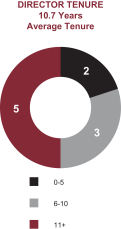
DIRECTOR TENURE 8.7 YEARS Average Tenure 5 4 1 0-5 years 6-10 years 11-15 years
1112
Summary information about our director nominees and overall composition of our Board is provided in the matrix and graphs below. Further information about each director nominee may be found on the following pages.
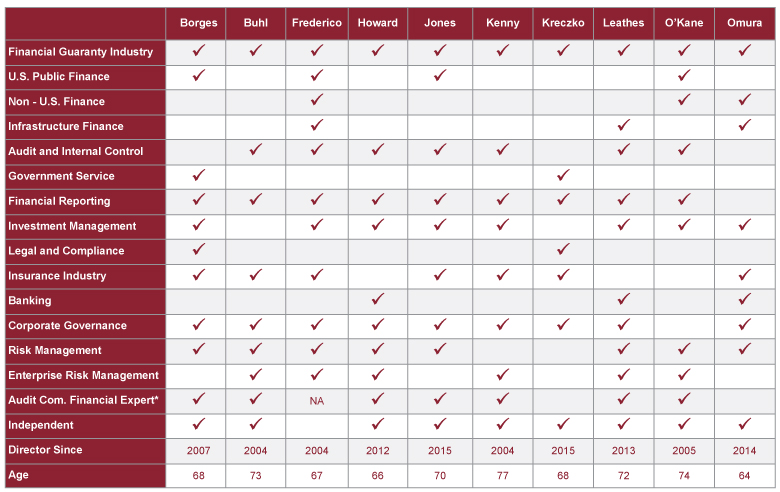
 |  |  |  |
| * | In the case of persons who are not currently serving on the Audit Committee, the individual is likely to be qualified to be an audit committee financial expert based on their experience, but was not designated as such by the Board of Directors this year. |
13
NOMINEES FOR DIRECTOR
Francisco L. Borges
Chairman of the Board
Director Since:2007
Committee Memberships:
Nominating and Governance (Chair)
Executive (Chair) Environmental and Social Responsibility |   |
Qualifications:
Mr. Borges has expertise in finance arising from his experience structuring and marketing financial guaranty insurance.insurance, and in investment management. In addition, his public service background has given him insight on public finance. His current position gives Mr. Borges insights into the financial markets in which our Company operates.operates and will be particularly useful as our Company expands its asset management business. Each of these areas is important to our business.
Biography:
Mr. Borges, age 66,68, became a director of AGL in August 2007, and has been Chairman of our Board of Directors since May 2015. He is Chairman of Landmark Partners, LLC, an alternative investment management firm where he has been employed since 1999. Prior to joining Landmark, Mr. Borges was managing director of GE Capital’s Financial Guaranty Insurance Company and capital markets subsidiaries. Mr. Borges is a former Treasurer for the State of Connecticut and a former Deputy Mayor of the City of Hartford, Connecticut.
Mr. Borges serves onalso chairs the board of directors for Connecticut Public Broadcasting Network,trustees of the Knight Foundation and is a member of the board of trustees for the Millbrook School. He is also a member of the board of directors of Davis Selected Funds, where he serves on the Pricing Committee, and Leucadia National Corporation,Jefferies Financial Group Inc., where he serves on the Audit Committee and the Nominating and Corporate Governance Committee.
G. Lawrence Buhl
Independent Director
Director Since:2004
Committee Memberships:
Audit (Chair)
Compensation |   |
Qualifications:
Mr. Buhl’s insurance and Board experience and his knowledge of specific financial reporting requirements applicable to financial guaranty companies and familiarity with compliance, finance, governance, control environment and risk management requirements and processes for public companies and the financial guaranty industry benefit the Board in its deliberations and oversight.
Biography:
Mr. Buhl, age 71,73, became a director of AGL upon completion of our 2004 initial public offering. Through 2003, Mr. Buhl served as the Regional Director for Insurance Services in Ernst & Young LLP’s Philadelphia, New York and Baltimore offices and as audit engagement partner for insurance companies, including those in the financial guaranty industry.
Mr. Buhl began in 2004 to serveserved as a director for Harleysville Group, Inc. (NASDAQ: HGIC) and its majority shareholder, Harleysville Mutual Insurance Company, from 2004 through their 2012 merger/combination with Nationwide Mutual Insurance Company and served on an Advisory Board to Nationwide through April 2014. Mr. Buhl has beenis a member of the Board of Directors of Penn National Insurance Group in Harrisburg, PAPa. since April 2015 and is also an emeritus member of the Board of Sponsors of the Sellinger School of Business and Management of Loyola University Maryland.
1214
Dominic J. Frederico
Chief Executive Officer
Director Since:2004
Committee Memberships:
Executive |   |
Qualifications:
Mr. Frederico has the most comprehensive knowledge of all aspects of our operations as well as executive experience. He also has extensive industry experience, which makes him valuable both as an officer and as a director of AGL.
Biography:
Mr. Frederico, age 65,67, has been a director of AGL since our 2004 initial public offering, and the President and Chief Executive Officer of AGL since 2003. During his tenure as President and Chief Executive Officer, our Company became the leading provider of municipal bond insurance and financial guaranties. Under his leadership, our Company completed its 2004 initial public offering and, in 2009, acquired the financial guaranty insurance company now named Assured Guaranty Municipal Corp., thereby bringing together the only two monoline bond insurers to continue writing financial guaranty policies before, during and after the 2008 financial crisis.
Mr. Frederico served as Vice Chairman of ACE Limited (now known as Chubb Limited) from 2003 until 2004 and served as President and Chief Operating Officer of ACE Limited and Chairman of ACE INA Holdings, Inc. from 1999 to 2003. Mr. Frederico was a director of ACE Limited from 2001 through May 2005. From 1995 to 1999, Mr. Frederico served in a number of executive positions with ACE Limited. Limited, during which period he oversaw the successful acquisition and integration of the domestic and international property casualty operations acquired by ACE Limited from CIGNA Corporation in July 1999 and the acquisition of Capital Re Corp., the predecessor company to our Company, in December 1999.
Prior to joining ACE Limited, Mr. Frederico spent 13 years working for various subsidiaries of the American International Group.
His last position at the group was Senior Vice President and Chief Financial Officer of AIG Risk Management.
Bonnie L. Howard
Independent Director
Director Since:2012
Committee Memberships:
Risk Oversight (Chair)
|   |
Qualifications:
Ms. Howard’s background in audit, finance and enterprise risk management is valuable to the Board in its oversight of our financial reporting and credit and risk management policies.
Biography:
Ms.Bonnie L. Howard, age 64,66, became a director of AGL in August 2012. Ms. Howard has more than 30 years of experience in credit, risk management and financial reporting policies. She worked at Citigroup, Inc. from 2003 to 2011, serving as Chief Auditor from 2004 to 2011 and Global Head of Control and Emerging Risk from 2010 to 2011, leading a team of over 1,500 professionals covering $1.9 trillion of assets in over 100 countries, until her retirement in 2011. She was previously Managing Director of Capital Markets Audit at Fleet Boston Financial and a Managing Director at JPMorgan in the roles of Deputy Auditor and head of Global Markets Operational Risk Management. Ms. Howard is a certified public accountant in the United States and has over a decade of experience with KPMG and Ernst & Young.
Ms. Howard currently serves on the board of directors of Artisan Partners Fund, where she chairs the Audit Committee. Ms. Howard previously served on the board of directors of BMO Financial Corp., where she iswas a member of the Audit Committee, and the board of directors of BMO Harris Bank N.A., where she chairschaired the Directors’ Trust Committee and the Audit Committee. Ms. Howard also serves on the board of directors of Artisan Partners Fund.Committee, until April 2018.
1315
Thomas W. Jones
Independent Director
Director Since:2015
Committee Memberships:
Audit
|
 |
Qualifications:
Mr. Jones’ background has given him extensive experience in investment management and in the operations of large financial institutions, which is valuable to the Board.Board as our Company expands its asset management business. His previous service on the boards of other financial services companies and the Federal Reserve Bank of New York adds value to the Board and Board committee deliberations.
Biography:
Mr. Jones, age 68,70, became a director of AGL in August 2015. Mr. Jones is the founder and senior partner of venture capital firm TWJ Capital LLC. Prior to founding TWJ Capital in 2005, he was the chief executive officer of Global Investment Management at Citigroup, which included Citigroup Asset Management, Citigroup Alternative Investments, Citigroup Private Bank and Travelers Life & Annuity. Earlier, he held a series of positions at TIAA-CREF, including vice chairman and director, president and chief operating officer, and executive vice president and chief financial officer, and at John Hancock Mutual Life Insurance Company, where he rose to senior vice president and treasurer. He began his career in public accounting and management consulting, primarily at Arthur Young & Company (predecessor to Ernst & Young).
A trustee emeritus of Cornell University, Mr. Jones has served on numerous boards in the past, including those of the Federal Reserve Bank of New York (where he was vice chairman), Altria Group, Freddie Mac, Travelers Group, Fox Entertainment Group, Pepsi Bottling Group and TIAA-CREF. Mr. Jones has been designated Board Leadership Fellow by the National Association of Corporate Directors (NACD), and is a licensed Certified Public Accountant (CPA).
Patrick W. Kenny
Independent Director
Director Since:2004
Committee Memberships:
Compensation (Chair)
Nominating and Governance
Executive |
 |
Qualifications:
Mr. Kenny has extensive insurance industry experience, including executive experience within the industry. In addition, the Board benefits from Mr. Kenny’s experience serving as a Board member of several Voya funds as our Company expands its asset management business, as well his experience as an accountant.
Biography:
Mr. Kenny, age 75,77, became a director of AGL upon completion of our 2004 initial public offering. He served as the President and Chief Executive Officer of the International Insurance Society in New York, an organization dedicated to fostering the exchange of ideas through a program of international seminars and sponsored research, from 2001 to 2009. From 1998 to 2001, Mr. Kenny served as executive vice president of Frontier Insurance Group, Inc. From 1995 to 1998, Mr. Kenny served as senior vice president of SS&C Technologies. From 1988 to 1994, Mr. Kenny served as Group Executive, Finance & Administration and Chief Financial Officer of Aetna Life & Casualty.
Until 2018, Mr. Kenny servesserved on the board of directors of several Voya funds, where he iswas a member of the Audit Committee and until 2018, was the Chairperson of the Nominating and Governance Committee. Until December 2009, Mr. Kenny was a director and member of the Audit and the Compensation committees of Odyssey Re Holdings Corp. Mr. Kenny was also a director of the Independent Order of Foresters from 1997 to 2009.
1416
Alan J. Kreczko
Independent Director
Director Since:2015
Committee Memberships:
Finance
Environmental and Social Responsibility (Chair) |
|
Qualifications:
Mr. Kreczko’s lengthy service in senior legal and policy positions both in the federal government and in the insurance industry, as well as the global and governmental perspective he has gained, are valuable to the Board. Mr. Kreczko’s experience chairing The Hartford’s Environment Committee makes him particularly valuable as the chair of our Environmental and Social Responsibility Committee.
Biography:
Mr. Kreczko, age 66,68, became a director of AGL in August 2015. Mr. Kreczko retired from The Hartford Financial Services Group, Inc., which we refer to as The Hartford, on December 31, 2015, where he served as executive vice president and general counsel from June 2007 until June 2015. In that capacity, Mr. Kreczko oversaw the law department, government affairs, compliance and communications. Additionally he chaired The Hartford’s Environment Committee. From June 2015 until December 2015, he served as Special Advisor to the CEO.
Mr. Kreczko joined The Hartford in 2003 after 27 years in public service at the United States Department of State, where he held various senior positions. As the Acting Assistant Secretary of State for Population, Refugees and Migration, he led the department’s response to humanitarian crises in conflict situations, including Afghanistan, Timor, and West Africa. Before that, Mr. Kreczko served as special assistant to President Clinton and legal advisor to the National Security Council. Earlier, he participated in sensitive bilateral and multilateral negotiations as deputy general counsel to the Department of State and as legal advisor to the personal representatives for Middle East negotiations of Presidents Carter and Reagan. Mr. Kreczko is the Executive Vice Chair of the Boys and Girls Clubs of Hartford and serves on the board of directors of the Mark Twain House.
Simon W. Leathes
Independent Director
Director Since:2013
Committee Memberships:
Risk Oversight
Executive
|
|
Qualifications:
Mr. Leathes’ considerable experience in investment and risk management, as well the institutional knowledge gained through his directorshipsdirectorship of our Company’s U.K. affiliates,affiliate, is valuable to the Board and its committees.
Biography:
Mr. Leathes, age 70,72, joined the Board of AGL in May 2013. From 2012 to 2017, Mr. Leathes was anon-executive director of HSBC Bank plc and was a member of its Risk Committee and its Audit Committee; he was also anon-executive director and member of the Audit and Risk Committees of HSBC Trinkaus & Burkhardt AG. In December 2011, he became an independent,non-executive director of our Company’s U.K. insurance subsidiaries,subsidiary, Assured Guaranty (Europe) plc. Mr. Leathes also served as an independent,non-executive director of our Company’s two other U.K. insurance subsidiaries: Assured Guaranty (UK) plc and Assured Guaranty (UK) plc; in January 2017 he was appointed to the samenon-executive director role with(London) plc, until November 7, 2018 when they were consolidated into Assured Guaranty (London) plc after it was acquired by our Company. Since(Europe) plc. From 1996 to 2018, Mr. Leathes has served as anon-executive director ofHSB-Engineering Insurance Ltd., a U.K. subsidiary of Munich Re, where he was the chairman of the Audit and Finance committee.Committee.
Mr. Leathes served as Vice Chairman and Managing Director of Barclays Capital, the investment banking subsidiary of Barclays plc, from January 2001 until his retirement in December 2006. In addition, he served from 2001 to 2010 as anon-executive director of Kier Group plc, a company listed on the London Stock Exchange, where he also served as chairman of the Audit Committee and a member of the Remuneration and Nominations committees. Until June 2014, Mr. Leathes served as the chairman of the trustees of the Kier Group Pension Scheme.
1517
Michael T. O’Kane
Independent Director
Director Since:2005
Committee Memberships:
Finance (Chair)
Audit |
 |
Qualifications:
Mr. O’Kane’s background has given him considerable experience in investment and risk management, both of which are key aspects of our business and are important to the Board and Board committee deliberation.
Biography:
Mr. O’Kane, age 72,74, became a director of AGL in August 2005. From 1986 until his retirement in August 2004, Mr. O’Kane was employed at TIAA-CREF (financial products) in a number of different capacities, most recently as Senior Managing Director, Securities Division. In that capacity, he oversaw approximately $120 billion of fixed income assets and approximately $3.5 billion of private equity fund investments.
From 2006 to 2013, Mr. O’Kane served as a director of Jefferies Group, Inc., where he was a member of the Audit, Compensation and Governance committees. In March 2013, Jefferies merged into Leucadia National Corporation, where Mr. O’Kane now serves as the lead director and as a member of the Compensation and the Nominating and Governance committees.
Yukiko Omura
Independent Director
Director Since:2014
Committee Memberships:
Finance
Risk Oversight |
 |
Qualifications:
Ms. Omura brings more than 30 years of international professional experience in the financial sector working in major financial centers of the world. Her global experience adds considerable value to the Board.
Biography:
Ms.Yukiko Omura, age 62,64, joined the Board of AGL in May 2014. She is anon-executive director of Nishimoto HD Co. Ltd. and anon-executive member of the Board of Directors of the Private Infrastructure Development Group, where she is chair of the Board of its subsidiary, GuarantCo. Ms. Omura has been nominated to beis also anon-executive director of HSBC Bank Plc. Ms. Omura was a Supervisory Board Member of Amatheon Agri Holding N.V. until March 2018. She served as Undersecretary General and Vice President/COO of the International Fund for Agricultural Development (IFAD) until February 2012 and, prior to that, as Executive Vice President and CEO of the Multilateral Investment Guarantee Agency (MIGA) of the World Bank Group.
Ms. Omura began her career as a project economist with the Inter-American Development Bank, working in the infrastructure sector. She then worked in senior positions at several major investment banks in Tokyo, New York and London over the course of her career, including JP Morgan, Lehman Brothers, UBS and Dresdner Bank. At UBS and Dresdner Bank, she was Managing Director and Head of Global Markets and Debt Division, Japan.
In 2002, Ms. Omura created the HIV/AIDS Prevention Fund, a charitable company based in London.
1618
INFORMATION ABOUT OUR COMMON SHARE OWNERSHIP
HOW MUCH STOCK IS OWNED BY DIRECTORS AND EXECUTIVE OFFICERS?
The following table sets forth information, as of March 8, 2018,13, 2020, the record date for our Annual General Meeting, regarding the beneficial ownership of our Common Shares by our directors and executive officers whose compensation is reported in the compensation tables that appear later in this proxy statement, to whomwhich persons we refer as our named executive officers, and by the group comprising our directors, and those persons who, as of December 31, 2017,2019, constituted our named executive officers and other executive officers. Unless otherwise indicated, the named individual has sole voting and investment power over the Common Shares under the column “Common Shares Beneficially Owned.” The Common Shares listed for each director and executive officer constitute less than 1% of our outstanding Common Shares, except that Mr. Frederico beneficially owns approximately 1.39%1.69% of our Common Shares. The Common Shares beneficially owned by all directors, named executive officers and other executive officers as a group constitute approximately 2.54%3.82% of our outstanding Common Shares.
Name of Beneficial Owner
| Common
| Unvested
| Restricted
| Common
| Common Shares Beneficially Owned | Unvested Restricted Common Shares(1) | Restricted Share Units(2) | Common Shares Subject to Option(3) | ||||||||||||||||||||||||
Robert A. Bailenson | 144,398 | — | 158,863 | 43,558 |
| 202,156 |
|
| — |
|
| 137,368 |
|
| — |
| ||||||||||||||||
Francisco L. Borges | 203,981 | 12,919 | — | 7,658 |
| 224,751 |
|
| 10,657 |
|
| — |
|
| 7,658 |
| ||||||||||||||||
Russell B. Brewer II | 126,713 | — | 104,476 | 29,362 |
| 180,847 |
|
| — |
|
| 72,580 |
|
| — |
| ||||||||||||||||
G. Lawrence Buhl | 48,394 | 3,823 | — | 7,026 |
| 57,749 |
|
| 3,154 |
|
| — |
|
| — |
| ||||||||||||||||
Ling Chow |
| 49,450 |
|
| — |
|
| 76,820 |
|
| 3,898 |
| ||||||||||||||||||||
Dominic J. Frederico(4) | 1,286,467 | — | 508,944 | 312,055 |
| 1,561,234 |
|
| — |
|
| 403,634 |
|
| — |
| ||||||||||||||||
Bonnie L. Howard | 22,874 | 3,823 | — | — |
| 29,076 |
|
| 3,154 |
|
| — |
|
| — |
| ||||||||||||||||
Thomas W. Jones | 12,521 | 3,823 | — | — |
| 18,723 |
|
| 3,154 |
|
| — |
|
| — |
| ||||||||||||||||
Patrick W. Kenny | 50,322 | 6,591 | — | 13,561 |
| 60,196 |
|
| 3,806 |
|
| — |
|
| 4,955 |
| ||||||||||||||||
Alan J. Kreczko | 15,846 | 7,777 | — | — |
| 28,381 |
|
| 7,068 |
|
| — |
|
| — |
| ||||||||||||||||
Simon W. Leathes | 11,009 | 3,823 | — | — |
| 15,434 |
|
| 3,154 |
|
| — |
|
| — |
| ||||||||||||||||
James M. Michener(5) | 206,281 | — | 94,978 | — | ||||||||||||||||||||||||||||
Michael T. O’Kane | 46,803 | 3,823 | — | 7,026 |
| 57,660 |
|
| 3,154 |
|
| — |
|
| — |
| ||||||||||||||||
Yukiko Omura | 7,585 | 3,823 | — | — |
| 12,010 |
|
| 3,154 |
| �� |
| — |
|
| — |
| |||||||||||||||
Bruce E. Stern | 109,287 | — | 69,346 | 24,925 |
| 157,290 |
|
| — |
|
| 33,597 |
|
| — |
| ||||||||||||||||
All directors and executive officers as a group (15 individuals)(6) | 2,406,399 | 50,225 | 1,026,587 | 472,590 | ||||||||||||||||||||||||||||
All directors and executive officers
|
|
3,464,019 |
|
|
40,455 |
|
|
832,615 |
|
|
16,511 |
| ||||||||||||||||||||
| (1) | The reporting person has the right to vote (but not dispose of) the Common Shares listed under “Unvested Restricted Common Shares.” |
| (2) | The Common Shares associated with restricted share units are not deliverable as of March |
This column includes 37,907 share units allocated to Mr. Bailenson and 28,872 share units allocated to another executive officer, due to their elections to invest a portion of their AG US Group Services Inc. Supplemental Executive Retirement Plan accounts in an employer stock fund. |
| (3) | Represents Common Shares which the reporting person has the right to acquire as of March |
| (4) | Common shares beneficially owned by Mr. Frederico include shares owned by Mr. Frederico’s spouse and daughter, and shares owned by a family trust, over which Mr. Frederico has the power to direct the voting and disposition. Common Shares beneficially owned by Mr. Frederico include 900,000 shares he pledged in March 2020, in accordance with our stock trading policy, to secure a personal loan to purchase a home. Mr. Frederico intends to repay the loan and release the pledged shares in the short-term. |
19
| (5) | Mr. Stern resigned |
| (6) | Giving effect to the resignation of Mr. |
17
WHICH SHAREHOLDERS OWN MORE THAN 5% OF OUR COMMON SHARES?
The following table shows all persons we know to be direct or indirect owners of more than 5% of our Common Shares as of the close of business on March 8, 2018,13, 2020, the record date for the Annual General Meeting, except to the extent indicated.Meeting. On March 8, 2018, 114,967,80013, 2020, 92,270,245 Common Shares were outstanding, including 50,22540,455 unvested restricted Common Shares. Our information is based on reports filed with the SEC by each of the firms listed in the table below. You may obtain these reports from the SEC.
Name and Address of Beneficial Owner
| Number of Shares Beneficially Owned
| Percent of Class
| ||||||
The Vanguard Group 100 Vanguard Blvd. Malvern, PA 19355 |
|
|
|
|
|
| ||
Wellington Management Group LLP c/o Wellington Management Company LLP 280 Congress Street Boston, MA 02210 |
|
|
|
|
|
| ||
BlackRock, Inc. 55 East 52nd Street New York, NY 10055 |
|
|
|
|
| |||
Putnam Investments, LLC. 100 Federal Street Boston, MA 02110 | 7,318,989(4) | 7.93% |
| |||||
| (1) | Based on a Schedule |
| (2) | Based on a Schedule |
| (3) | Based on a Schedule 13G filed by BlackRock, Inc. on February |
| (4) | Based on a Schedule 13G filed by Putnam Investments, LLC on February 14, 2020, reporting the amount of securities beneficially owned as of December 31, 2019. Putnam Investments, LLC has sole voting power over 1,252,499 shares and sole dispositive power over 7,318,989 shares. |
1820
Our executive compensation program is designed to attract and retain talented and experienced business leaders who drive our corporate strategies and build long-term shareholder value.
The guiding principles of our program are:
|
|
|
|
We assessCompensation Committee assesses performance usingpre-established measures of success that are tied to our key business strategies. We encourageThis approach encourages balanced performance, measured relative to financial andnon-financial goals as well as measures of shareholder value, and share price goals, and discouragediscourages excessive risk taking or undue leverage by avoiding too much emphasis on any one metric, or on short-term results.
OurIn 2019, we exceeded every financial goal set by our Compensation Committee determineslast year.
For 2019, our executive officers’ compensationgross written premiums were $677 million, the highest in February of eachten years, while our new business production in the insurance segment, anon-GAAP financial measure we refer to as PVP*, was $463 million, also the highest reported in ten years (when excluding our 2018 portfolio reinsurance transaction with SGI**). In 2019, our shareholders’ equity attributable to Assured Guaranty Ltd. per share, adjusted operating shareholder’s equity per share*and adjusted book value per share* all reached record levels, at $71.18, $66.96 and $96.86, respectively. In addition, we will look back on 2019 as the year with much of the compensation based on quantitative and qualitative performance goals, objectives and formulas established at the beginning of the relevant year for performance during that year,we took our first significant step in establishing our asset management business, Assured Investment Management, by acquiring BlueMountain Capital Management, LLC, which we refer to as our performance year. Accordingly, in February 2018 our Compensation Committee determined our executive officers’ performance-based cash awards, performance-based equity awardsBlueMountain, and time-based equity awards based on their performance during the 2017 calendar year, which we refer to as the 2017 performance year. These compensation components are backward-looking, in the sense that they reflect performance in the just completed performance year. Also in February 2018, our Compensation Committee set our executive officers’ base salaries, which are forward-looking, in the sense that they are intended to motivate the recipients during the year in which they are paid, and established the quantitative and qualitative performance goals for the upcoming 2018 performance year.
In 2017, our shareholders’ equity per share,non-GAAP operating shareholder’s equity* per shareandnon-GAAP adjusted book value* per share all reached record levels, at $58.95, $56.20 and $77.74, respectively. Our growth in shareholder’s equity per share was 16% and our growth innon-GAAP adjusted book value* per share was $11.28, the largestone-year dollar increase in our history. Our net income for the year was $730 million, or $5.96 per share, and ournon-GAAP operating income* was $661 million, or $5.41 per share, even after taking a tax expense of $61 million against our net income and $35 million against our non-GAAP operating income for the estimated impact of the 2017 Tax Cut and Jobs Act, which we refer to as the 2017 Tax Act.associated entities.
These results were driven in part by our successful pursuit of all four of our primary business strategies:
We increased new business production in our insurance segment, with contributions from our U.S. public finance, • Gross written premiums • In the U.S. public finance market, we continued to lead the market with a • In thenon-U.S. public finance market, we generated • In the structured finance market, we produced $51 million of PVP. • We produced these results while still producing new business that had a higher average internal rating in 2019 than in 2018 and with higher average risk-adjusted premiums in 2019 than 2018. |
We made substantial progress in the insurance loss mitigation area. • In May, we signed with most of the relevant parties a new restructuring and support agreement for the Puerto Rico Electric Power Authority, which is awaiting approval by the court. • In September, we sold the exchange bonds we received in connection with the resolution of the Puerto Rico Sales Tax Financing Corporation (COFINA), putting our first significant Puerto Rico credit in the rearview mirror. • ���We continue to negotiate with representatives of the Commonwealth of Puerto Rico with respect to other Puerto Rico credits, while continuing to assert our rights though litigation until the Commonwealth and its advisors respond with solutions that recognize creditors’ rights, the requirements of the federal Puerto Rico Oversight, Management, and Economic Stability Act (PROMESA), and constitutional requirements of the U.S. and Puerto Rico. |
| * | Adjusted operating shareholder’s equity, adjusted book value, adjusted operating income and PVP arenon-GAAP financial measures. An explanation of these measures, which are considered when setting executive compensation, and a reconciliation to the most comparable GAAP measures, may be found on pages 106 to 110 of our Annual Report on Form10-K for the year ended December 31, 2019. |
| ** | PVP is meant to be a measure of the strength of new business production in our insurance business, and the Compensation Committee does not consider the 2018 portfolio reinsurance transaction with SGI to be typical new business origination. It views the best measure of PVP as one that excludes the impact of strategic transactions such as the SGI portfolio reinsurance transaction. Without that SGI transaction, our 2018 PVP was $272 million. |
22
We took our first significant step in establishing Assured Investment Management by purchasing BlueMountain. • We closed on our purchase of BlueMountain on October 1, 2019, and appointed itsco-founder and chief executive officer, Andrew Feldstein, as our Chief Investment Officer and Head of Asset Management. • Our establishment of Assured Investment Management will allow us to diversify our revenue opportunities, adding afee-based revenue stream that is not capital consumptive and can enable us to generate cash flow and operating income. • Assured Investment Management provides new growth opportunities and significant synergies with our core competencies. • By purchasing BlueMountain, we have become one of the top 20 collateralized loan obligation managers when measured by assets under management*. • In addition, we are using the knowledge base and experience acquired from BlueMountain to expand the categories and types of investments included in our investment portfolio.
|
We further managed our capital, primarily by returning excess capital to our shareholders through repurchases of our Common Shares and quarterly dividends. • We returned approximately • • Over the last |
20
• We
|
|
We achieved these results despite a persistently challenging business environment.
Over the last several years, municipal bond yields have been at historically low levels and credit spreads have been tight, making our product less attractive to issuers. In 2019, municipal interest rates reached new lows and credit spreads tightened further. The30-year AAA Municipal Market Data rate started the year off at 3.02% and ended the year at 2.09%. Credit spreads tightened during the year as the spread between “A” and “AAA”30-year general obligation fell from 51 basis points (bps) to start the year to as low as 35 bps on July 24th. It remained near that relatively narrow level through the end of the year. This is compared to an average of 53 bps in 2018 and 2017. The30-year AAA Municipal Market Data benchmark yields reached 1.83% on August 28th, the lowest yield since the benchmark was first published in June 1981. In early 2020, the benchmark yield hit a subsequent new low.
We have continued to accumulate excess capital at our insurance companies as our insured portfolios have amortized. While we believe we have reached an inflection point where, assuming a stable capital market environment, we should insure as much new insured par as the amount of our insured portfolio that amortizes, there are regulatory constraints to moving capital in excess of that needed to support our insurance segment to businesses that could provide more earnings, and these constraints reduce our capital efficiency.
We also continued to face pricing competition in an already tightcertain segments of the market from a secondanother financial guaranty insurer that focuses onserves a smaller portion of the market than we do and provides price competition in those markets where we overlap.serve.
The achievements described in this section were important considerations in determining the compensation of our named executive officers for the 20172019 performance year.
21
| * | As reported by Creditflux for the fourth quarter of 2019. |
23
After the price ofThe market rewarded us for our Common Shares reached $45.38 in the summer of 2017, the highest since our 2004 initial public offering, the price fell in the aftermath of the landfall of Hurricane Maria in the Commonwealth of Puerto Rico in September 2017, ending 2017 at $33.87 compared to $37.77 atyear-end 2016. Despite this, theaccomplishments with a 30% total shareholder return which we refer to as TSR, on our Common Shares has been admirable overfor the last several years in relation to relevant S&P index measures and our comparison group.year, double the previous year’s return.
The table and chart below depict the dollar changecumulative TSR in the cumulative TSRdollars on our Common Shares from December 31, 20122014 through December 31, 2017 as compared2019, relative to the cumulative total returnTSR of the Russell Midcap Financial Services Index, Standard & Poor’s 500 Stock Index and the cumulative total return of the Standard & Poor’s 500 Financials Index over the same period. The table and chart depict the value on December 31 of each year from 20122014 through 20172019 of a $100 investment made on December 31, 2012,2014, with all dividends reinvested:
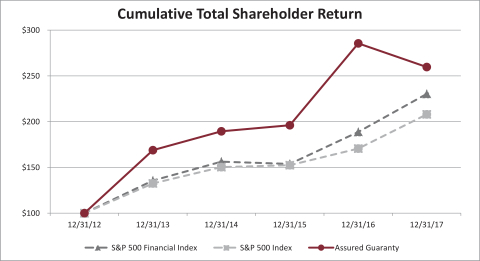
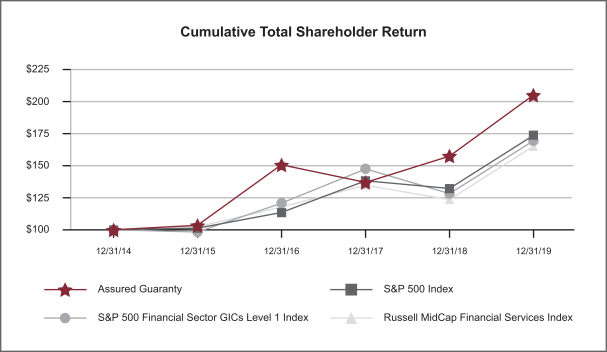
| Assured Guaranty | S&P 500 Index | S&P 500 Financial Index | ||||||||||||||||||||||||
12/31/2012
|
100.00
|
100.00
|
100.00
| |||||||||||||||||||||||
12/31/2013
|
168.84
|
132.37
|
135.59
| |||||||||||||||||||||||
Cumulative TSR from 12/31/14 | Assured Guaranty | S&P 500 Index | S&P 500 Financial Sector GICs Level 1 Index | Russell MidCap Financial Services Index | ||||||||||||||||||||||
12/31/2014
|
189.42
|
150.48
|
156.17
|
| 100.00 |
| 100.00 |
| 100.00 |
| 100.00 | |||||||||||||||
12/31/2015
|
196.05
|
152.54
| 153.74
|
| 103.50 |
| 101.37 |
| 98.44 |
| 102.35 | |||||||||||||||
12/31/2016
|
285.45
|
170.77
|
188.71
|
| 150.70 |
| 113.49 |
| 120.83 |
| 117.86 | |||||||||||||||
12/31/2017
|
259.65
|
208.03
|
230.49
|
| 137.08 |
| 138.26 |
| 147.58 |
| 137.44 | |||||||||||||||
12/31/2018 |
| 157.58 |
| 132.19 |
| 128.33 |
| 123.64 | ||||||||||||||||||
12/31/2019 |
| 205.06 |
| 173.80 |
| 169.52 |
| 165.13 | ||||||||||||||||||
Calculated from total returns published by Bloomberg.
Our 21.04% per annum five-year TSR exceeded the S&P 500 Index’s 15.79% per annum return and the S&P 500 Financial Index’s 18.19% per annum return over the same period.
OurAs shown below, our cumulative TSR also exceeded the average cumulative TSR of our executive compensation comparison group over the last two, three and five years, despite our negativeone-year TSR, which we attribute primarily to developments related to Puerto Rico.years. Our executive compensation comparison group was revised this year and is described on page 44pages 48 to 49 under “Executive“Compensation Governance—Executive Compensation Comparison Group.”
Total Shareholder Return Comparison
Comparison Group Average TSR | Assured Guaranty TSR | ||||||||||||||||||
| Period Ending 12/31/19 | Comparison Group Average TSR | Assured Guaranty TSR | |||||||||||||||||
1 Year
|
-1.9%
|
-9.0%
|
| 37.61 | % |
| 30.13 | % | |||||||||||
2 Years
|
25.0%
|
32.4%
| |||||||||||||||||
3 Years
|
21.3%
|
37.1%
|
| 32.22 | % |
| 36.07 | % | |||||||||||
5 Years
|
117.4%
|
159.7%
|
| 62.76 | % |
| 105.06 | % | |||||||||||
Calculated from total returns published by Bloomberg.
Cumulative Total Shareholder Return S&P 500 Financial Index S&P 500 Index Assured Guaranty
2224
20172019 Results Against Financial Performance Measure Targets
The Compensation Committee attributed the disappointing one-year TSR result primarily to developments related to Puerto Rico, including the impactWe exceeded all of the landfall of Hurricane Maria. The Compensation Committee believed it was therefore particularly important to measure our success in creating value using other available objective measures.
In February 2017,2019 financial performance goals set by the Compensation Committee, establishedin some instances by large amounts. The table below summarizes our 2019 results against the 2019 targets for fivethe financial performance goals for our executive officers for the 2017 performance year.measures. The financial performance goals were based on the business plan that the Board of Directors reviewed and approvedare explained in November 2016 and were designed to measure our progress in creating value for our shareholders. The financial performance goals use the same measures as those that the Compensation Committee used when assessing the executive officers’ achievements for the 2014 through 2016 performance years. We believe the price of our Common Shares will reflect the progress these targets measure once there is less uncertainty regarding the outcome in Puerto Rico.
Page 31more detail under “Executive Compensation Program Structure and Process” contains a detailed descriptionProcess—Components of the financial performance goals, and why theOur Executive Compensation Committee considers themProgram—Cash Incentive Compensation” on pages 30 to be important in assessing our Company and our executive officers’ performance. All of these arenon-GAAP financial measures. We refer to four of these financial measures as “core” to distinguish them from other similarnon-GAAP financial measures that have not been adjusted to exclude the impact of consolidating financial guaranty variable interest entities, which we refer to as FG VIEs. The four “core” measures have been adjusted to exclude the impact of consolidating FG VIEs. Page 48 under“Non-GAAP Financial Measures” contains a description of the adjustments we make to the most comparable GAAP financial measures to arrive at these measures.
The Compensation Committee considered the unique earnings model of the financial guaranty industry in designing its five financial performance goals for our executive officers. When a financial guarantor writes a new financial guaranty policy, it does not earn the full amount of the premium immediately; rather, the premium for the policy is earned over the period of the policy, often as long as twenty or thirty years. In 2017, for example, only approximately 5% of the premiums we earned related to new financial guaranty policies we wrote in 2017. As a consequence, the premiums a financial guarantor earns in a year are primarily related to business it has written over a long period, in our case decades. Such earnings may be accelerated in the event insured public finance obligations are refunded and when the insurance on insured structured finance obligations is canceled or terminated, but such acceleration also reduces earnings from the current portfolio for future periods. Our earnings in a particular year may also be impacted by, among other things, strategic activities such as acquisitions or reassumptions of previously ceded insured par and changes in investment income, loss reserves and expenses. However, the volume and pricing of new business written in a year has only a small impact on premium earnings for that year. As a consequence, we set a target for PVP, which more directly measures business production during the year. We also want to encourage our executive officers to build intrinsic value in our Company over time for our shareholders, so we set targets for core operating shareholder’s equity per share and core adjusted book value per share. We also set targets for core operating income per diluted share and core operating return on equity, but since most of our financial guaranty earnings in a year are derived as a result of insurance policies written in previous decades, we set those targets in relation to our projections of earnings on the existing inforce portfolio rather than in relation to the previous year’s results or targets.
We significantly exceeded four out of five of our targets and, ifeither (a) the price of our Common Shares had not increased in the middle of the year and we had been able to repurchase the number of Common Shares we originally projected we would with $500 million,or (b) if it had not been for the 2017 Tax Act (which was adopted well after the goals were established), we would have exceeded them all. The table below summarizes our 2017 results against the targets.32 below.
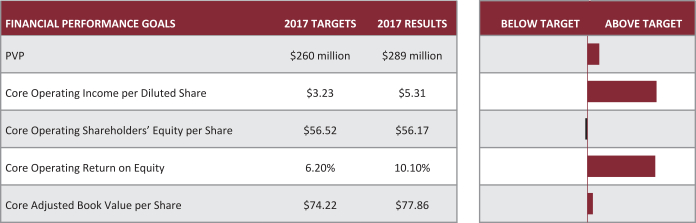
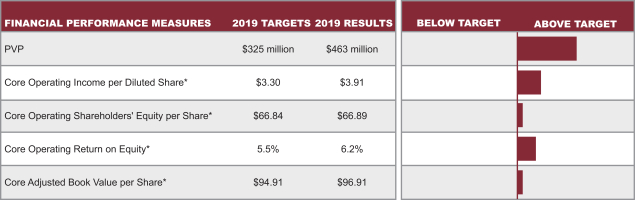
The Compensation Committee viewed all of the 2017 targets for the financial performance goals as challenging in light of current market conditions, particularly interest rate levels. It had set all of the 2017 targets above the comparable 2016 targets (except core operating return on equity, which we refer to as ROE) and above the comparable 2016 actual results (except core operating income per diluted share and core operating ROE).
23
Our Compensation Committee set our 2017 targets for core operating income per diluted share above our 2016 target but lower than 2016 actual results and core operating ROE lower than our 2016 target and our 2016 actual results in large part due to the nature of a financial guarantor’s earnings, as described above. As a result of the amortization of the insured portfolio from 2016, we projected lower premium earnings in 2017 regardless of the amount of new financial guaranty insurance we originated in 2017. We also project potential public finance refundings, which we refer to as refundings, based on the volume of insured bonds reaching the dates beyond which they can be redeemed (generally ten years after issuance) and the level of interest rates currently compared to ten years ago. Based on these factors, we projected lower refundings for 2017 than we had experienced in 2016. We also determined that, with the amortization of our structured finance portfolio, particularly the portion written in credit default swap form, there were few remaining opportunities for cancellation or termination of the insurance on such structured finance obligations, which we refer to as terminations. Finally, we noted that our purchase of CIFG Holding Inc., which we refer to as CIFG, in 2016 significantly impacted our 2016 earnings and that our ability to consummate strategic transactions with similarly significant impacts in 2017 was uncertain. As a result, the Compensation Committee determined that the targets it set for these two financial measures would be difficult to attain despite being lower than the 2016 actual results and in one case lower than the 2016 target.
The Compensation Committee was aware that, given the anticipated decline of earned premium and the uncertainty of acquisition and other strategic transactions, the executive officers also would be required to manage losses and make strategic moves to meet all of the targets except for PVP.
As noted above, in 2017, we exceeded all but one of the 2017 targets for the financial performance goals and, had it not been for the increase in our Common Share price, which caused us to repurchase fewer shares than we had planned although we met our goal of repurchasing $500 million of Common Shares, or the impact of the 2017 Tax Act, we would have exceeded all of the targets:
The financial targets are based onnon-GAAP financial measures and four of the |
Given that we would have achieved our core operating shareholders’ equity per share financial performance goal if either the price of our Common Shares had not risen in the middle of the year as much as it did or if the 2017 Tax Act had not been enacted, neither of which was in the control of our senior management, the Compensation Committee viewed the target as substantially met and awarded an achievement score of 95% for this financial performance goal.
24
The weighted average achievement score resulting from the Company’s success in exceeding all but one of its financial performance goals in 2017 was 83.8%, as described under “CEO Performance Review–Cash Incentive”, and constitutedtwo-thirds of each executive officer’s total achievement score used to calculate that executive officer’s cash incentive compensation amount.
Our executive officers achieved these results despite a persistently challenging business environment that included low interest rates, tight credit spreads and competition in some markets.
Snapshot of Our CEO’s 20172019 Compensation
For 2017, approximately 89%2019, 89.3% of Mr. Frederico’s compensation constituted incentive compensation: 39%31.8% of his compensation was in the form of a performance-based cash incentive that was awarded based on measuring his performance against financial performance goals andnon-financial objectives set at the beginning of the year, and 50%57.5% was in the form of a long-term equity-based incentive, with half60% of that equity award subjectdependent on performance relative to achievingourpre-established share price hurdles.objectives. The allocation between his fixed and incentive compensation and between performance-based cash incentive and long-term equity-based incentive compensation, for the 20172019 performance year iswas generally consistent with the allocation for2018 performance year, while the 2016 performance year.portion of his incentive compensation comprising equity-based compensation increased from 54.2% to 57.5%.
Mr. Frederico received a compensation package for the 20172019 performance year 3.4%that was 6.0% higher than he received for the 20162018 performance year. The increase reflects Mr. Frederico’s considerable accomplishments with respect to the financial performance goals as well as hisnon-financial objectives, but also takes into account our negativeone-year TSR. The Compensation Committee concluded that, in light of ourone-year TSR, it was appropriate that
Mr. Frederico’s cash incentive compensation decreased by 2.2% from the prior year, largely as a function of $4,525,000the financial performance goal scores awarded by the Compensation Committee. Our performance exceeded every financial performance target set by the Compensation Committee at the beginning of the year. Nevertheless, in two instances where the results were above target but below the results from the previous year, the Compensation Committee chose to exercise its negative discretion and reduce the scores awarded on those measures to below what they would have been otherwise. As a result, the Compensation Committee awarded Mr. Frederico a weighted score on his financial performance goals of 83.1%, somewhat less than his score of 89.8% for 2018. While the 2017 performance year andCompensation Committee recognized Mr. Frederico’s extraordinary achievements in 2019 by awarding him a higher weighted score on his base salarynon-financial objectives, 66% for 2019 compared to 62.7% for 2018, largely remainhis total achievement score was held down by the same as the prior year.
Most of the 3.4% increase in Mr. Frederico’s compensation package for the 2017 performance year was due to the 4.5% increase in his long-term equity award, reflecting Mr. Frederico’s achievements over 2017, including especially our Company’s success in exceeding all but onenegative discretion exercised on two of the financial performance goals established byand, as a result, his resulting total achievement score of 149.1% for 2019 was down slightly from his total achievement score of 152.5% for 2018.
The Compensation Committee also considered the appropriate amount of long-term incentive equity compensation to award Mr. Frederico in light of his execution of a transformative acquisition that forms the basis of our establishment of our Assured Investment Management platform in the asset management business. In recognition of this accomplishment and the Compensation Committee’s strong desire that Mr. Frederico continue his leadership as we integrate the acquisition and transform our Company into a dual financial guaranty and asset management company, the Compensation Committee in certain cases substantially; and due togranted Mr. Frederico long-term equity compensation with a target nominal value of $6,750,000, an increase of $750,000 from his grant for the 8.7% increase in his base salary for 2017, which was awarded at the beginning of the 20172018 performance year based on Mr. Frederico’s accomplishments during the 2016 performance year and the importance of maintaining his strategic leadership in the future.year.
25
Mr. Frederico’s compensation packagespackage for 20172019 and 20162018 were composed of the following:
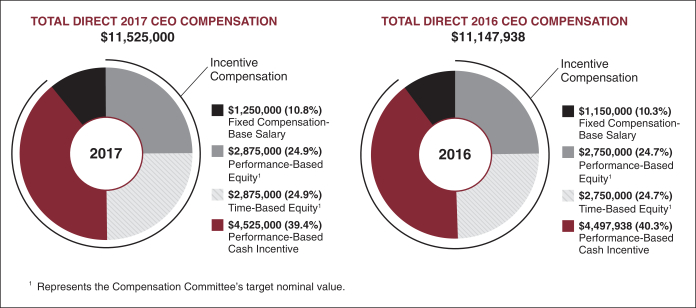
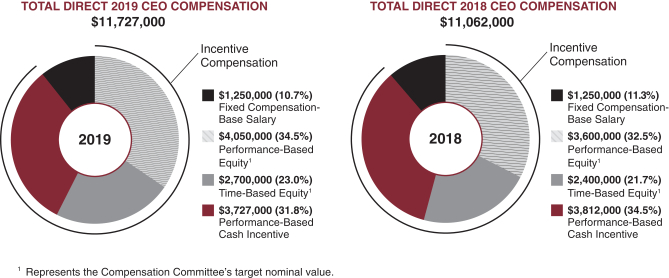
2019 Performance Year Compensation | 2018 Performance Year Compensation | Change from 2018 to 2019 Perf. Year | ||||||||||
Fixed Compensation—Base Salary(1) |
| $1,250,000 |
|
| $1,250,000 |
|
| — | % | |||
Incentive Compensation | ||||||||||||
Cash Incentive Compensation |
| $3,727,000 |
|
| $3,812,000 |
|
| (2.2 | )% | |||
Long-Term Performance-Based Equity |
| $4,050,000 | (2) |
| $3,600,000 | (2) |
| 12.5 | % | |||
Long-Term Time-Based Equity |
| $2,700,000 | (2) |
| $2,400,000 | (2) |
| 12.5 | % | |||
Total Direct Compensation |
| $11,727,000 |
|
| $11,062,000 |
|
| 6.0 | % | |||
| (1) | Mr. Frederico’s base salary for each of the 2019 and 2018 performance years was established at the beginning of such performance year, in February. Accordingly, Mr. Frederico’s 2019 base salary was established in February 2019 based on Mr. Frederico’s accomplishments in the 2018 performance year. |
| (2) | Represents the Compensation Committee’s target nominal value for the relevant performance year. The number of units granted is calculated by dividing such value by the average closing price on the NYSE of a Common Share over the 40 consecutive trading days ending on the date of grant. |
The compensation package presented in the table above is different from theSEC-required disclosure in the Summary Compensation Table on page 53 and is not a substitute for the information in that table. Rather, it is intended to show how the Compensation Committee linked Mr. Frederico’s compensation and its components to our performance results and his achievements for the prior year.
EXECUTIVE COMPENSATION PROGRAM STRUCTURE AND PROCESS
Overview of Philosophy and Design
Our executive compensation program is designed to recognize and reward outstanding achievement and to attract, retain and motivate the talented individuals needed to lead and grow our Company’s business. We maintain an ongoing dialog with our shareholders and incorporate their feedback into our program so that the program is aligned with their interests.
The guiding principles of our program are:
Pay for Performance by providing an incentive for exceptional performance and the possibility of reduced compensation if executives are unable to successfully execute our strategies | Accountability for short- and long- term performance | Alignment with | Retention of highly qualified executives |
26
We Align Pay With Performance
Our program rewards the performance by having moreof our most senior executives, who are directly responsible for our operational results, with a higher proportion of variable and performance-based compensation at the most senior levels.than it rewards lower level executives. We use a mix of variableat-risk compensation with different time horizons and payout forms to provide an incentive for both annual and long-term sustained performance, in order to maximize shareholder value in a manner consistent with our Company’s risk parameters. The Compensation Committee assesses the performance of our executive officers from both a financial and anon-financial perspective, usingpre-established goals.
Our executive officers canare eligible to receive aan annual cash incentive, which is performance-based.based on their performance againstpre-established goals over the previous year. They canmay also receive a long-term equity incentive, 50%the majority of which is performance-based and cliff vests at the end of a three-year performance period, if we achieve particular average share price targets, and 50%the remainder of which is time-based and cliff vests at the end of a three-year period. The long-term equity incentive is structured to encourage retention and a long-range mindset.
Executive Compensation Is Closely Tied To Long-Term Performance
The compensation program is structured with upside potential for superior executive achievements, but also the possibility of reduced compensation if executives are unable todo not successfully execute our Company’s strategies. By increasing management’s motivation to enhance shareholder value over the long term, our compensation program aligns executive officer incentives and shareholder interests.
26
For the 20172019 performance year, we maintained the same structure for the compensation package for theour executive officers contains three principal elements.as we did for the 2018 performance year:
| Principal Elements of Executive Compensation Package | ||
Base Salary |
Based on responsibilities, skill set and experience, and market measures
| |
Cash Incentive Compensation |
Cash reward for performance against annual financial performance goals and progress against strategicnon-financial objectives that we expect to drive our growth over the
| |
Long-Term Equity Incentives |
| |
Shareholder Outreach on Our Executive Compensation Program
For the past several years, we have been actively engagingengaged with our shareholders in order to obtain their feedback on our executive compensation program. Beginning inIn May 2018, after negative recommendations from the fall, we contact our large shareholders to invite them to speak directly with the chairman of the Compensation Committee.
We believe our shareholders support our executive compensation program. At each of our last three Annual General Meetings, investors holding over 98%two leading proxy advisory firms, only 60% of the Common Shares voting approved oursay-on-pay proposal. Both ofFollowing that 2018say-on-pay vote, we sought to engage with our shareholders with respect to the changes we proposed to make to the executive compensation program in response to the recommendations from the two leading proxy advisory firms and thesay-on-pay result, and based on advice from Cook. As part of Institutional Shareholder Services Inc.that process and Glass, Lewis & Co. LLC also recommended that our investors vote in supportcontinued dialogue with shareholders, we contacted holders of an aggregate of over 77% of oursay-on-pay proposal. Common Shares (which comprised every shareholder holding more than 0.16% of our outstanding shares). Based on the feedback from our shareholders and advice from Cook, we made a number of structural changes to our executive compensation program.
Even with
With respect to the strong supportshort-term cash incentive compensation, we reduced the CEO’s target individual cash multiple to 2.0x from 2.5x and introduced negative discretion for scoring the achievement of financial performance goals that were set below prior year actual results.
With respect to the long-term equity compensation, we increased the amount dependent on performance measures from 50% to 60% and introduced the two new types of PSUs described above.
We also ended our reimbursement of executives for the cost of financial planning.
27
In May 2019, after we made these structural changes to our executive compensation program receivedbased on discussions with our shareholders and advice from Cook, investors holding over 93% of the Common Shares voting approved oursay-on-pay proposal at our three most recent advisory votes, as the Compensation Committee began to determine compensation for the 2017 performance year,Annual General Meeting.
In late 2019 and into early 2020, we again sought to engage with our shareholders with respect to discuss their concerns and recommendations.compensation matters. We contacted holders of an aggregate of 67%nearly 76% of our outstanding Common Shares (which comprised every shareholder holding more than 1.5% of our outstanding Common Shares) and invited themoffered to speakdiscuss our executive compensation program. Holders of approximately 5.5% of our outstanding Common Shares provided us with Mr. Kenny,specific feedback on aspects of our executive compensation program in a conversation that included the chairman of theour Compensation Committee. While none of those holders accepted our invitation to speak to Mr. Kenny this year,Committee, while the holders of an aggregate27.3% of approximately 34% of our outstanding Common Shares specifically responded that they did not need to speak with us because they were comfortable with thehad no concerns about our executive compensation program. The investors we spoke to indicated they were generally pleased with the executive compensation program and with management’s performance, and on the whole found the program to reward management appropriately. Most shareholders were not prescriptive about plan design, and instead were more interested in seeing that results were aligned appropriately with performance. Certain shareholders supported tying long-term incentive compensation to the price of our Common Shares while others supported looking at other performance measures.
Our Compensation Committee takes theGiven this recent feedback from our shareholders into consideration when making itsas well as the 93% approval of oursay-on-pay proposal last May, the Compensation Committee chose to maintain the current executive compensation decisions.program without any changes.
The Compensation Committee, composed solely of independent directors, is responsible for all decisions aboutmade on our executive officer compensation. The Compensation Committee works closely with Cook, the Chairman of the Board and management to examine pay and performance matters throughout the year, and consults with the Board prior to making final compensation decisions.
The Compensation Committee conductsin-depth reviews of performance and then applies judgment to make compensation decisions. The Compensation Committee believes its process, described below, is an effective way to assess the quality of performance, risk management and leadership demonstrated by Mr. Frederico and the senior management team.
In August and November, the Compensation Committee reviews ouryear-to-date corporate performance, for the year to date, as well as progress of each executive officer against individual performance goals. The chairman of the Compensation Committee seeks feedback from our shareholders on our executive compensation program.
In November, the Compensation Committee reviews and approves the metrics and goals in our performance framework and reviews certain of the executive officer performance goals for the upcoming year, and begins to formulate its compensation decisions with respect to current year performance.
In February, the Compensation Committee meets twice. It first meets in early February to receive and review our final results and evaluate executive performance for the previous calendar year, which we refer to as the performance year, against that performance year’s goals andgoals. The Compensation Committee formulates its potentialpreliminary compensation decisions with respect to that year’s executive performance, along with the executive officer performance goals for the coming year. Later in February, the Compensation Committee discusses with other Board members its preliminary compensation decisions for the previous year and the executive officer performance goals for the coming year, and then makes its final decisions with respect to those matters. The CEO is not present when the Compensation Committee meets to evaluate his performance and determine his compensation.
2728
|
In making its compensation decisions, the Compensation Committee follows a five-step approach:
Step 5: Seek input from the independent consultant concerning CEO pay.
The Compensation Committee considers Cook’s analysis of the compensation paid to executive officers in our executive compensation comparison group when evaluating the compensation of our executive officers. The role of Cook is described in more detail below under “Compensation Governance—the Role of the Independent | ||||||||||||||||||||||||
Step 4: Analyze trends
The Compensation Committee considers market pay levels and trends based on information Cook provides about comparison companies. | ||||||||||||||||||||||||
Step 3: Review each executive’s individual performance and contributions.
The Compensation Committee reviews the individual performance objectives for our CEO and the other executive officers, and assesses each person’s performance and contributions. For the executive officers other than our CEO, the Compensation Committee considers individual performance assessments and compensation recommendations from our CEO, as well as succession planning and retention issues in this unique segment of the insurance industry. | ||||||||||||||||||||||||
Step 2: Assess Company Performance.
The Compensation Committee reviews the corporate financial performance goals for the performance year and discusses the full-year financial and strategic performance at length, seeking to understand what was accomplished relative to established objectives, how it was accomplished, and the quality of the financial results. | ||||||||||||||||||||||||
Step 1: Establishment of financial performance goals andnon-financial objectives.
At or prior to the beginning of each performance year, the Compensation Committee discusses the Company’s business plan at length and establishes corporate financial goals for the upcoming performance year. The Compensation Committee also discusses the strategic direction of the Company andestablishes non-financial objectives it expects to drive our growth over the | ||||||||||||||||||||||||
The Compensation Committee considers Cook’s analysis of the compensation paid to executive officers in our comparison group when evaluating the compensation of our executive officers.
Components of Our Executive Compensation Program
For the 20172019 performance year, the compensation package for the executive officers again consists of three principal elements: base salary, cash incentive compensation and long-term equity incentives. Our practice is to review the components of our executive officer compensation separately and monitor the total of the various components. We consider each component and the total against our compensation objectives described in “Overview of Philosophy and Design.” Decisions related to one compensation component (e.g., cash incentive compensation) generally do not materially affect decisions regarding any other component (e.g., long-term equity incentives) because the objectives of each element differ. Positions at higher levels generally have a greater emphasis on variable pay elements, although no specific formula, schedule or structure is currently applied in establishing the percentage of total compensation delivered through any compensation element.
Base Salary
The Compensation Committee establishes each executive officer’s base salary in consultation with Cook. We believe base salary is necessary to attract and retain key executives by providing appropriate compensation that is based on position, experience, scope of responsibility and performance. Base salary provides liquidity to our executive officers and balances the levels of guaranteed pay withat-risk pay to properly manage our compensation-related risk. The amount is based on the executive officer’s responsibilities, skills and experience, as well as market measures. The level of an executive officer’s base salary reflects the Compensation Committee’s view of the contribution that executive officer has consistently made to our Company’s success over several years, the continuing importance of that executive officer to our Company’s future, and the difficulty and expense of replacing the executive officer with one of a similar
28
caliber. The Compensation Committee does not guarantee salary adjustments on an annual basis.basis; in fact, our CEO’s base salary was last adjusted in February 2017. Base salary is set attoward the beginning of the year and is paid to the executive officers for ongoing performance throughout the year. For the 20172019 performance year, the Compensation Committee established theour executive officers’ base salarysalaries in February 2017.2019.
29
Cash Incentive Compensation
Unlike base salary, which is set at the beginning of the year in which it is paid, cash incentive compensation is determined after the end of the performance year to which such compensation relates. For the 20172019 performance year, the Compensation Committee determined the amount of the cash incentive compensation in February 2018.2020.
The Compensation Committee uses a formula to award cash incentive compensation in order to enhance the transparency of our process. The amount of cash incentive compensation is determined based on the extent to which the executives achieve certainpre-established performance targets. The Compensation Committee has used atwo-step process for granting and paying annual cash incentive compensation awards to our executive officers as detailed below, although changes made by the 2017 Tax Act may make the first step unnecessary in future years as described in greater detail under “Tax Treatment” below.
For the first step, in order for the payment of cash incentive compensation to qualify as performance-based compensation within the meaning of Section 162(m) of the Internal Revenue Code of 1986, as amended, which we refer to as the Internal Revenue Code, the Compensation Committee annually establishes a performance goal based on performance metrics, and awards the cash incentivetargets; 67% is tied to the executive officers pursuant to the Assured Guaranty Ltd. 2004 Long-Term Incentive Plan, as amended (LTIP), subject to such performance goal being met. If the performance goal is not met, no cash incentive will be awarded to the executive officers for such year. If the performance goal is met, a cash pool is established pursuant to which payments can be made to the executive officers subject to limitations contained in the LTIP and to further limitations established by the Compensation Committee in the grant. For the 2017 performance year, the performance goal for this first step was established in November 2016 and the Compensation Committee determined the extent to which it had been met in February 2018.
For the second step, if the Section 162(m) performance goal has been met for a particular performance year, the actual amountachievement of the cash incentive compensation payable to each executive officer for such performance year is then linked 67% to financial performance goals and 33% is tied to the achievement ofnon-financial objectives. The Compensation Committee considers the five financial performance goals to be important in assessing our Company and our executive officers’ performance; each goal has a weighting of 13.4% (for a total of 67%) and constitutes anon-GAAP financial measure that is described on pages 47 to 48page 52 under“Non-GAAP Financial Measures.” Similar to the financial performance goals, thenon-financial objectives also relate to matters that are important to our business. The Compensation Committee believes the qualitative objectives are necessary to fully evaluate the annual achievements that benefit our shareholders, and it does not individually weight thenon-financial objectives because it believes it is more appropriate to evaluate the level of achievement of all of thenon-financial objectives in their totality. Of the companies in
We provide a diagram of our comparison group, an analysis by Cook revealed that:
The Compensation Committee believes thepre-established target financial performance goals and individualnon-financial objectives are the most important for assessing Assured Guaranty’s performance and the value we create forawarding our shareholders. Therefore, performance relative to the financial goals andnon-financial objectives is the primary driver of the finalannual cash incentive compensation determined by the Compensation Committee in applying its discretion.below:
29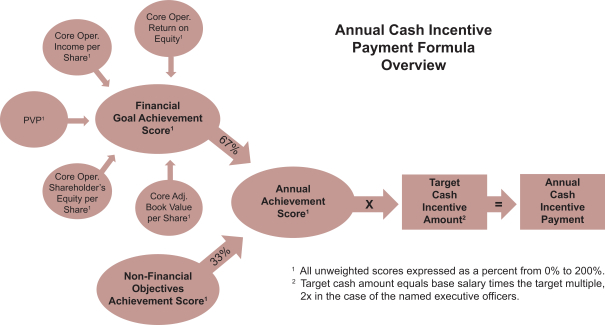
The financial performance goals for 20172019 for all the executive officers and thenon-financial objectives for 2017 forincluding Mr. Frederico, our CEO, are set out below. ForThenon-financial objectives for Mr. Frederico are set out on pages 39 to 41 under “CEO Performance Review—Cash Incentive—Mr. Frederico’sNon-Financial Objectives”, while thenon-financial objectives for the executive officers other than Mr. Frederico the Compensation Committee evaluates the extentare discussed on pages 43 to which those executives contributed to Mr. Frederico’snon-financial objectives and the extent of such executives’ personal achievements of their individualnon-financial objectives, which are discussed45 under “Compensation Decisions of Other Executive Officers.” For the 20172019 performance year, the financial performance goals and thenon-financial objectives for the named executive officers were established in February 20172019 and the Compensation Committee determined the extent to which they had been satisfied in February 2018.2020.
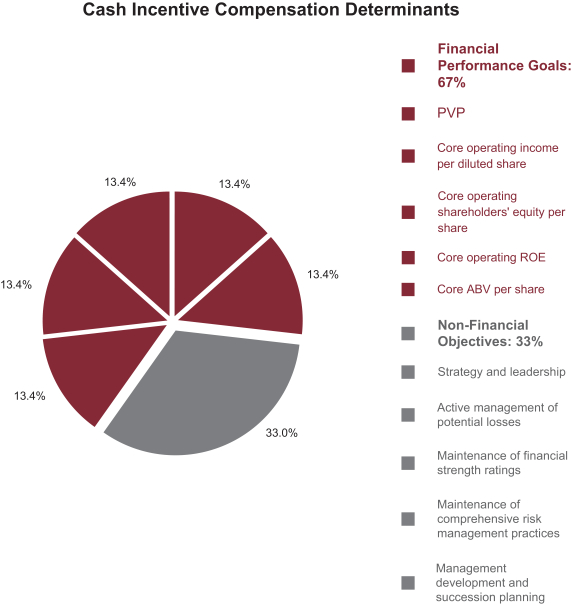
Cash Incentive Compensation Determinants Financial Performance Goals: 67% PVP Core operating income per diluted share Core operating shareholders’ equity per share Core operating ROE Core ABV per share Non-Financial Objectives: 33% Strategy and leadership Active management of potential losses Maintenance of financial strength ratings Maintenance of comprehensive risk management practices Management development and succession planning 13.4% 33.0% 13.4% 13.4% 13.4% 13.4%
30
The financial performance goals that the Compensation Committee uses to assess our Company’s performance are described in greater detail below. The financial goals are based onnon-GAAP financial measures and four of the five are labeled “core” to distinguish them from similarnon-GAAP financial measures. The four “core” measures that have not been adjusted to exclude the impact of consolidating FG VIEs. Seevariable interest entities, which we refer to as VIEs, while the similarnon-core measures have not been so adjusted. We include on page 52 under“Non-GAAP Financial Measures” on page 47 below.a description of the adjustments we make to the most comparable GAAP financial measures to arrive at these measures.
30
2019 Financial Performance Measures
PVP |
represents | |
Core operating income per diluted share |
enables us to evaluate the amount of income we are generating in our business without certain items, primarilynon-economic fluctuations and movements in fair value, foreign exchange movements related to long dated receivables and payables, and other adjustments, as well as removing the impact of consolidating | |
Core operating shareholders’ equity per share |
presents our equity | |
Core operating ROE |
represents core operating income for a specified period divided by the average of core operating shareholders’ equity at the beginning and the end of that period. This measure enables us to evaluate our return on the capital invested in our company. | |
Core ABV per share |
reflects our core operating shareholders’ equity, plus |
The Compensation Committee assigns each executive an Individual Target Cash Incentive Amount, which is calculated as a multiple of the executive officer’s base salary, and which we refer to as the Individual Target Cash Incentive Multiple, of the executive officer’s base salary.Multiple. The amounts of the base salary and Individual Target Cash Incentive Multiples vary by individualare set based on the executive officer’s position and level of responsibility, historic pay level, importance to the future strategic direction of our Company and Cook’s advice about the compensation practices of companies in our comparison group. All of the
The Compensation Committee assigns an Individual Target Cash Incentive Multiples assigned byMultiple to each executive in the Compensation Committee for the 2017 performance year were the same as it had assigned the previous year, except that Mr. Stern’s multiple was increased from 1.75x to 2.0x in recognition of his contributions to our strategic initiatives, including reinsurance reassumptions, and the active role he is playing in our loss mitigation activities, especially with regard to Puerto Rico.executive compensation program. The Compensation Committee assigned each of the named executive officers the followingan Individual Target Cash Incentive Multiples forMultiple of 2.0x, the 2017 performance year:same as last year. Last year, in response to the previous year’ssay-on-pay vote result and based on shareholder feedback and advice from Cook, the Compensation Committee had reduced Mr. Frederico’s multiple from 2.5x to 2.0x.
| ||||
| ||||
| ||||
| ||||
| ||||
| ||||
Then, for each executive officer, the Compensation Committee calculates and aggregates the weighted achievement scores for the financial performance goals and the individualnon-financial objectives. When assessing the level of achievement and assigning scores for the year, the Compensation Committee takes into account the difficulty of achieving particular goals or objectives. The Compensation Committee has discretion to assign achievement scores of up to 200% for outstanding performance and achievement scores of down to 0% for performance below target, based on its view of the level of achievement attained for each financial performance goal and each individualnon-financial objective.
The Compensation Committee may exercise negative discretion where the financial performance goal result, while above the target established by the Compensation Committee, is less than the prior year result. For the 2018 performance year, the Compensation Committee exercised this negative discretion with respect to both financial performance goals where the 2018 results were above 2018 targets but below 2017 actual results. For this year, the 2019 performance year, the Compensation Committee again exercised this negative discretion with respect to two financial performance goals where the 2019 results were above the 2019 targets but below the 2018 actual results. Our 2019 PVP was above the 2019 goal and also above the 2018 actual when PVP from the SGI reinsurance transactions is excluded, so the Compensation Committee did not view this as an instance where it would be appropriate to exercise its negative discretion.
Setting Financial Performance Goals
The Compensation Committee selected the five financial performance goal measurements in 2015 when, in consultation with Cook, it redesigned our process and formula for determining the amount of short-term cash incentive to award to our executives. At the time, the Compensation Committee considered the measures of value creation used by our then executive compensation comparison group and also the unique earnings model of the financial guaranty industry. The Compensation Committee reconsiders each year whether these measures are the appropriate ones to use in light of our Company’s business. The Compensation Committee believes our progress measured against these goals will, over the long term, result in optimal total shareholder return.
31
Each year the Compensation Committee sets our five financial performance goals at levels it views as challenging based on the projected operating results in our annual business plan. The goals and our business plan acknowledge the unique long-term nature of our financial guaranty insurance business and that the required accounting treatment and operations of a financial guaranty insurer are distinct from other insurance product lines.
PVP. Our annual business plan for 2019 challenged our executives to originate more financial guaranty business in 2019 than we originated in 2018. Our most direct measurement of new business origination is PVP. However, our reported 2018 PVP of $663 million also included the impact of a portfolio reinsurance transaction we completed with SGI, which resulted in $391 million of PVP in 2018. PVP is meant to be a measure of the strength of new business production in our insurance business (we do not consider the 2018 portfolio reinsurance transaction with SGI to be typical new business origination). The Compensation Committee views the best measure of PVP as one that excludes the impact of strategic transactions such as the SGI portfolio reinsurance transaction. Without that SGI transaction, our 2018 PVP was $272 million. The Compensation Committee set our 2019 PVP performance goal of $325 million nearly 20% higher than our actual 2018 PVP exclusive of the SGI portfolio reinsurance transaction, despite our expectation that interest rates and credit spreads were likely to remain low (which they did). Given this expectation of a challenging business environment, the Compensation Committee viewed the PVP goal as quite challenging.
Core Operating Income per Diluted Share and Core Operating Return on Equity. The financial performance goals the Compensation Committee set for core operating income per diluted share and core operating return on equity, based on the same annual business plan that challenged us to originate more business in 2019 than in 2018 (excluding the impact of the SGI reinsurance transaction) despite the challenging business environment, were set lower than the actual results for these measures in 2018. Why would the Compensation Committee set these financial performance goals at levels that were below our prior year actual results, and still view those goals as challenging?
The answer to that question follows from the unique earnings model of the financial guaranty insurance industry. When a financial guarantor writes a new financial guaranty policy, it does not earn the full amount of the premium immediately; rather, it earns the premium for the policy over the term of the policy, often as long as twenty or thirty years. In 2019, for example, only approximately 3% of the premiums we earned in 2019 related to new financial guaranty policies we wrote in 2019. The premiums a financial guarantor earns in a year are primarily related to business it wrote some time ago, in our case over decades, rather than its originations in that year. Because the volume and pricing of new business written in a particular year has only a small impact on premium earnings for that year, most of our operating income from our core financial guaranty business may be forecast based on projections with respect to the very significant unearned premium that we earn as our insured portfolio amortizes, the income we earn on our sizable investment portfolio, and our operating expenses, all of which are reasonably predictable.
Despite the relative predictability of the contribution of our primary financial guaranty business to our core operating income per diluted share and core operating return on equity, we consider the financial performance goals we set for these measures to be challenging due to potential uncertainties in the broader market and environment. Those uncertainties include unexpected changes to investment rates, level of refunding activity and unexpected loss development. In addition, variability of our share price and availability of funds for share repurchases may add to the challenges of reaching these goals.
Over the last several years we have increased the insured portfolio through strategic transactions with legacy bond insurers. Such transactions have significantly increased our future earnings power. Our 2019 unearned premium reserve, which is a measure of the premium we will earn in the future from insurance business we have already written and which we refer to as UPR, was higher than our 2018 UPR, reflecting the premium rate we have been able to maintain while, at the same time, maintaining the credit quality of the new business we have written. Because the significant increases to UPR from strategic, non-repeating transactions exceed the rate at which we are able to increase the UPR based on new business from the insurable market in the recent low credit spread environment, the Compensation Committee believes the core operating income goal it set, while lower than the prior year result, was still challenging.
Our core operating ROE is also negatively impacted by the amount of excess capital we continue to have. Despite the strides we have made in managing our capital (see “Summary – 2019 Achievement Highlights” on page 23), we believe we still have excess capital that we need regulatory approval to deploy, and therefore are constrained in our ability to improve our capital efficiency and our core operating ROE.
32
Core Operating Shareholders’ Equity Per Share and Core Adjusted Book Value Per Share. The Compensation Committee also wants to encourage our executives to build intrinsic value in our Company over time for our shareholders, so the Compensation Committee sets targets for core operating shareholders’ equity per share and core adjusted book value per share. The Compensation Committee believes these measures best capture the long-term value we are building for our shareholders and that growth in these measures will eventually result in growth in the price of our Common Shares. The Compensation Committee believes that core adjusted book value per share, in particular, is such an important measure of the intrinsic value we are building for our shareholders that the Compensation Committee has made this measure a component of both our short-term and long-term incentive programs. The Compensation Committee believes that this will motivate our executives to focus on growth in this measure in both the short and long term, and that eventually growth in the price of our Common Shares will follow.
Calculating Cash Incentive Compensation
Based on thean executive officer’s achievements of these priorities,weighted achievement scores for the financial performance goals and the individualnon-financial objectives, the individual payouts of the cash incentive for 20172019 were calculated as follows:
Annual Individual Target Cash Incentive Amount | X | Annual Achievement Score (a percentage from 0% to 200%) | = | Annual Cash Incentive Payout | ||||||||||||||||||||
| ( |
Base Salary |
X |
Individual Target Cash Incentive Multiple | ) |
X | ( |
Financial Goal Achievement Score (weighted 67%) | + |
Individual Non- Financial Objective Achievement Score (weighted 33%) | ) | = |
Incentive Payout | ||||||||||||
The basic formula for determining cash incentive compensation has remained the same since the Compensation Committee developed the approach to calculating such amount,methodology, together with Cook, at the beginning of 2015. Our2015, and our Company’s share price performance and performance on other key financial measures has improved greatly since the approach was developed at the beginning of 2015.that time. At year end 2014, the price of our Common Shares closed at $25.99, compared to $33.87$49.02 at year end 2017.2019. Our performance in respect of four out of five of the financial performance goals most important to our Company has also improved, as reflected in the table below.
| FINANCIAL PERFORMANCE GOALS | 2014 Results | 2017 Results | 2014
| 2019
| ||||||||||||
PVP | $ | 168 million | $ | 289 million |
| $168 million |
|
| $463 million |
| ||||||
Core Operating Income per Diluted Share | $2.83 | $5.31 |
| $2.83 |
|
| $3.91 |
| ||||||||
Core Operating Shareholders’ Equity per Share | $37.48 | $56.17 |
| $37.48 |
|
| $66.89 |
| ||||||||
Core Operating Return on Equity | 8.1 | % | 10.1 | % |
| 8.1 | % |
| 6.2 | % | ||||||
Core Adjusted Book Value per Share | $53.66 | $77.86 |
| $53.66 |
|
| $96.91 |
| ||||||||
The progress we have made on these fronts is the result of the leadership of Mr. Frederico and the efforts of his management team. As a result, the Compensation Committee has maintainedretained the approachsame general methodology and the formulas put in place for the cash incentive compensation implemented in 2015 for Mr. Frederico and the other named executive officers. However, in 2019, in response to the previous year’ssay-on-pay vote result and based on shareholder feedback and advice from Cook, the Compensation Committee had reduced Mr. Frederico’s multiple from 2.5x to 2.0x and introduced negative discretion in the scoring of financial performance goals when the result exceeds the year’s target but is less than the prior year result.
Long-Term Equity Incentives
In addition to the cash incentive compensation, the Compensation Committee awards long-term incentive compensation in the form of our Common Shares.
Like cash incentive compensation, equity incentive compensation is awarded after the end of the performance year to which such compensation relates. For the 20172019 performance year, the Compensation Committee determined the amount of equity incentive compensation in February 2018.2020.
HalfSixty percent of the nominal value of the award is in the form of performance share units (which we refer to as PSUs) that may be earned over a3-year performance period based on share pricepre-established performance targets, and are paid at the end of the3-year performance period if particular share priceperformance targets are achieved, and the other halfremaining forty percent is in the form of RSUs that cliff vest at the end of a3-year period. Details about the individual awards are set out in “CEO Performance Review” and “Other Named Executive Officer Compensation Decisions.”
33
For the 2020 grant with respect to the 2019 performance year, the proportion of the long-term equity incentive comprising performance-based PSUs was 60%.
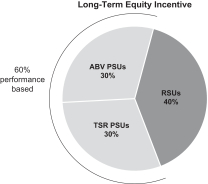
Performance Share Units.Each performance share unit, or PSU, represents a contingent right to receive up to twoa certain number of our Common Shares as described under “Incentive Plans – Plans—Assured Guaranty Ltd. 2004 Long-Term Incentive Plan” on page 58.62. The Compensation Committee awards performance share unitsPSUs with the intent of aligning executive pay with our Company’s performance.
Prior to the grants made in February 2019 for the 2018 performance as measured byyear, the pricenumber of our Common Shares.
The percentage of performance share units anShares executive canofficers could earn isfor each PSU was based on the price of our Common Shares over a3-year performance period. For each 40 consecutive trading day sequence that occurs during the last 18 months of a performance period we calculate the averagein relation to price of a Common Share as traded on the New York Stock Exchange during that time. The highest average is used to determine whether a share price hurdle has been reached, and consequently, the percentage of the performance share units that has been earned. Use of the highest average share price during the last 18 months of the performance period mitigates concerns that short-term gains may yield payouts even if long-term performance lags, and was a refinement madehurdles established by the Compensation Committee at the time of grant. Based on shareholder feedback and advice from Cook, the Compensation Committee chose to replace these PSUs with respecttwo new types of replacement PSUs for the February 2019 grant. The Compensation Committee maintained the same structure for the February 2020 grant:
PSUs tied to growth in our core adjusted book value per share over a three-year period, which we refer to as ABV PSUs; and
PSUs tied to our TSR over a three-year period relative to the 2014 performance yearTSR of the 55th percentile of the Russell Midcap Financial Services Index, which we refer to address shareholder concerns raised atas Relative TSR PSUs.
ABV PSUs
The Compensation Committee believes that time.Core ABV per share is the best measure of the intrinsic value of our Common Shares, and that growth in Core ABV per share will eventually result in growth in the price of our Common Shares. The Compensation believes that this measure is so important that it has incorporated the measure into both its short-term cash incentive program and its long-term equity compensation program, so that the executives are motivated to grow Core ABV per share on both a short-term and long-term basis.
32Each ABV PSU represents the right to receive up to two of our Common Shares at the end of a three-year performance period, which runs from January 1 of the year of the grant to December 31 three years later, depending on the growth in Core ABV per share over the three-year performance period.
| • | The target growth rate is an aggregate of 15% over that three-year period, for which the executive officer earns one Common Share for each ABV PSU. |
| • | At 80% of the target growth (or 12%), which we refer to as the threshold, the executive officer earnsone-half share for each ABV PSU; for growth rates below that amount, the executive officer earns no Common Shares. |
| • | At 120% of the target growth (or 18%) or above, which we refer to as the maximum, the executive officer earns two of our Common Shares for each ABV PSU. |
For Core ABV per share growth rates between the threshold and the target and between the target and the maximum, the amount of our Common Shares earned for each ABV PSU is based on straight-line interpolation.
34
The Compensation Committee set the ABV PSU target growth rate based on the projected operating results in our annual business plan and after consulting with Cook. In consideringsetting the awards for 2017 performance,ABV PSU target, the Compensation Committee did not consider significant potential or theoretical strategic activities that had not been finalized or share repurchases the funding of which require regulatory approvals that have not yet been obtained, because the conditions for success are highly contingent and Cook determinedoutside of the executive officers’ control. Given the outsize positive impact on our Company of the successful achievement of at least some such endeavors, the Compensation Committee believes it is appropriate for its executive officers to usebe encouraged to pursue success in these areas through the same methodologyABV PSUs. The targets are unchanged from last year.
Relative TSR PSUs
Since our ultimate goal is to provide as much value to our shareholders as possible, the Compensation Committee believes that our long-term equity incentive compensation should also be based on our TSR. However, recognizing that share prices may be influenced by a number of factors, the Compensation Committee decided that a relative measure of TSR was most appropriate.
Each Relative TSR PSU represents the right to receive up to 2.5 (for extraordinary performance at the 95th percentile) of our Common Shares at the end of a three-year performance period, which runs from January 1 of the grant year to December 31 three years later, depending on the performance of our TSR over that three-year period relative to the TSR of the Russell Midcap Financial Services Index, which we refer to as the Index.
The target Company TSR for calculating whetherthat period is the 55th percentile of the Index, for which the executive officer earns one Common Share for each Relative TSR PSU.
At the 25th percentile of the Index, which we refer to as the threshold, the executive officer earnsone-halfshare price hurdle had been reachedfor each Relative TSR PSU; for Company TSRs below that level, the executive officer earns no Common Shares.
A Company TSR at the 95th percentile of the Index, which we refer to as had been appliedthe maximum, or above earns the executive officer 2.5 of our Common Shares for each Relative TSR PSU.
For Company TSRs between the 2016 performance year. threshold and the target and between the target and the maximum, the amount of our Common Shares earned for each Relative TSR PSU is based on straight-line interpolation.
The Compensation Committee adopted the following additional restrictions on the Relative TSR PSUs:
The number of Common Shares that can be earned is capped at one share per Relative TSR PSU if the Company TSR is negative, even if above the 55th percentile.
Common Shares earned pursuant to the Relative TSR PSUs remain restricted until one year after they vest.
Prior to establishing the TSR PSUs in February 2019, the Compensation Committee sought advice from Cook last year in selecting an index for a target TSR and Cook also reviewedin establishing the rigor of the share price hurdlestarget, threshold and maximum TSR levels and the vesting percentage atnumber of our Common Shares awarded for each hurdle. For the performance share units granted for the 2017 performance year, in February 2018,Relative TSR PSU.
When the Compensation Committee established the share price hurdlesTSR PSUs in February 2019, it considered and vesting percentages set out in the table below. The table shows the percentage that could be earned if the highest average share price over 40 consecutive trading days occurring in the second halfrejected a number of the 2018-2020 performance period reaches the stated share price hurdles.other options:
| Highest 40 consecutive trading day average share price hurdle | % Earned | |
$42 | 50% | |
$46 | 100% | |
$50 | 200% |
The share price hurdles represent increases over the $28/$32/$36 hurdles that applied for the grants for the 2014 and 2015 performance years and are unchanged from the hurdles that applied for the grants for the 2016 performance year.
In making its decision with respect to the hurdles, the Compensation Committee considered the price of our Common Shares in 2017 and asked Cook to prepare an analysis with respect to Cook’s recommendation that the Compensation Committee maintain the current share price hurdles. Cook presented data on theone-, three- and five-year compound annual growth rates of the S&P 500 Financial Index, our Company’s comparison group median stock performance, and the stock performance of a subset of certain companies within the comparison group in order to obtain hypothetical minimum and maximum ranges for the hurdles. Cook then applied the ranges to the Company’s average share price over 40 consecutive trading days as of a recent date of the analysis, and utilized those results to evaluate the current share price hurdles.
The Compensation Committee considered Cook’s analysis as well asestablishing a peer group of companies against which to measure our Company’s TSR, but only one other financial guarantor continues to write new business, and that company is not publicly traded.
The Compensation Committee considered establishing a peer group of property and casualty insurance companies, an industry in which we are sometimes grouped by analysts, but determined that factors including the extent to which particular hurdles would exceed the 40 consecutive trading day average (i) at the beginning ofimpacting the performance periodof property and (ii) ascasualty insurance companies are unlikely to impact our business in the same way, particularly given the unique long-term nature of our financial guaranty insurance business and the fact that the required accounting treatment and operations of a date close to the grant date. For all three of the hurdles, the amount of the excess over the 40 consecutive trading day average at the beginning of the performance periodfinancial guaranty insurer are distinct from property and as of a date close to the grant date was greater than that of the prior year grant.casualty and other insurance product lines
The Compensation Committee also notedconsidered using the extentexecutive compensation comparison group it uses to evaluate the level and mix of compensation it pays its executives. While the executive compensation comparison group comprisessimilarly-sized companies in businesses somewhat similar to our business, most of the total equity payout as a percentage abovecompanies in that group are mortgage finance and property and casualty insurance and reinsurance companies and the GAAP value and above the nominal value of the equity at the time of grant, under the methodologyCompensation Committee did not believe that the committee had developed with Cook. group was an appropriate benchmark for our TSR.
The Compensation Committee examinedbelieved that aspects of our business are comparable to aspects of various financial services companies, and so determined that the benefitbest benchmark for our TSR was a broad index of somewhatsimilarly-sized financial services companies, and selected the Russell Midcap Financial Services as the best available measure.
35
We engaged Aon plc, which we refer to as Aon, to model the grant date valuation of the equity grantsRelative TSR PSUs and to track the executive officers compared toRelative TSR PSUs in the cost to our Company. In addition, the Compensation Committee reviewed other relevant statistics for the performance periods, including our Company’s TSR and the TSR of the S&P 500 Financial Index and our comparison group average TSR, and the growth in core operating book value and in core ABV, during those periods.future.
Restricted Stock Units.Units
Each restricted stock unit represents a right to receive one of our Common Shares at the end of a three-year vesting period as described under “Incentive Plans – Plans—Assured Guaranty Ltd. 2004 Long-Term Incentive Plan” on page 57. 62.
The Compensation Committee awards RSUs with the intent of providing executives with long-term incentive compensation thethat increases in value of which increase as our Company achieves its strategies. The Compensation Committee believes this incentivizes executives to remain with the Company and help build shareholder value over the long term. The Compensation Committee has been awarding RSUs to our executives for a number of years now. For the 2020 grant for the 2019 performance year, the Compensation Committee allocated 40% of the long-term equity incentive to RSUs, the same as last year and down from 50% from the prior year.
33
In light of Mr. Frederico’s achievementssignificant accomplishments in the 2017 performance year, as detailed below, but also considering our negativeone-year TSR, the Compensation Committee awarded him total compensation of $11,525,000, a 3.4% increase over his total compensation for the 2016 performance year. The Compensation Committee concluded that, in light of our negativeone-year TSR, it was appropriate that Mr. Frederico’s cash incentive for 2017 and his base salary for 2018 largely remain the same as the prior year. Most of the 3.4% increase in Mr. Frederico’s compensation package for the 2017 performance year was due to the 4.5% increase in his long-term equity award, which reflects his achievements in the 20172019 performance year, as detailed below, and also considering shareholder feedback and advice from Cook, the 8.7%Compensation Committee awarded Mr. Frederico total compensation of $11,727,000, a 6.0% increase infrom his base salarytotal compensation for 2017, which wasthe 2018 performance year.
Mr. Frederico’s cash incentive compensation decreased by 2.2% from the prior year, largely as a function of the financial performance goal scores awarded by the Compensation Committee. Our performance exceeded every financial performance target set by the Compensation Committee at the beginning of the 2017year. Nevertheless, in two instances where the results were above target but below the results from the previous year, the Compensation Committee chose to exercise its negative discretion and reduce the scores awarded on those measures to below what they would have been otherwise. As a result, the Compensation Committee awarded Mr. Frederico a weighted score on his financial performance goals of 83.1%, somewhat less than his score of 89.8% for 2018. While the Compensation Committee recognized Mr. Frederico’s extraordinary achievements in 2019 by awarding him a higher weighted score on hisnon-financial objectives than for the 2018 performance year, based66% for 2019 compared to 62.7% for 2018, his total achievement score of 149.1% was held down by the negative discretion exercised on two of the financial performance goals and, as a result, his resulting total achievement score of 2019 was down slightly from his total achievement score of 152.5% for 2018.
The Compensation Committee also considered the appropriate amount of long-term incentive equity compensation to award Mr. Frederico in light of his execution of a transformative acquisition that forms the basis of our establishment of our Assured Investment Management platform in the asset management business. In recognition of this accomplishment and the Compensation Committee’s strong desire that Mr. Frederico continue his leadership as we integrate the acquisition and transform our Company into a dual financial guaranty and asset management company, the Compensation Committee granted Mr. Frederico long-term equity compensation with a target nominal value of $6,750,000, an increase of $750,000 from his grant for the 2018 performance year. Mr. Frederico’s accomplishments in the 2016 performance year and the importance of maintaining his strategic leadership. Mr. Frederico’stotal compensation for the 20172019 performance year was composed of the following:
2017 Performance Year
| 2016 Performance Year
| |||||||||||||||||||
2019 Performance Year Compensation | 2018 Performance Year Compensation | Change from 2018 to 2019 | ||||||||||||||||||
Fixed Compensation—Base Salary(1)
|
| $1,250,000
|
|
| $1,150,000
|
|
| $1,250,000
|
|
| $1,250,000
|
|
| —
| %
| |||||
Incentive Compensation | ||||||||||||||||||||
Cash Incentive Compensation | $4,525,000 | $4,497,938 | $3,727,000 | $3,812,000 | (2.2 | )% | ||||||||||||||
Long-Term Performance-Based Equity | $2,875,000 | (2) | $2,750,000 | (2) | $4,050,000 | (2) | $3,600,000 | (2) | 12.5 | % | ||||||||||
Long-Term Time-Based Equity
|
| $2,875,000
| (2)
|
| $2,750,000
| (2)
|
| $2,700,000
| (2)
|
| $2,400,000
| (2)
|
| 12.5
| %
| |||||
Total Direct Compensation
| $
| 11,525,000
|
| $
| 11,147,938
|
|
| $11,727,000
|
|
| $11,062,000
|
|
| 6.0
| %
| |||||
| (1) | Mr. Frederico’s base salary for each of the |
| (2) | Represents the Compensation Committee’s target nominal value for the relevant performance year, using the average stock price over the 40 consecutive trading days ending on the date of |
36
The compensation package presented in the table above is different from theSEC-required disclosure in the Summary Compensation Table on page 5052 and is not a substitute for the information in that table. Rather, it is intended to show how the Compensation Committee linked Mr. Frederico’s compensation and its components to our performance results and his achievements for the prior year. The base salary is paid during the performance year, while all of the components of the incentive compensation is based on achievements during the performance year and so is awarded in the first partquarter of the following year.
In February 2017, in light of Mr. Frederico’s accomplishments in 2016 and the importance of maintaining his strategic leadership in the future, particularly in respect of managing our capital, mitigating the risks in our insured portfolio, and deciding upon appropriate alternative investments that complement our financial guaranty business and core competencies, the Compensation Committee decided to grant him an 8.7% increase in his base salary, to $1,250,000, for the 2017 performance year.
In February 2018,2019, given the continued importance of maintaining Mr. Frederico’s strategic leadership, but also considering the result of our negativeone-yearsay-on-pay TSRvote in 2018 and the salary increase Mr. Frederico had received in February 2017 based on his performance in the 2016 performance year,shareholder feedback and advice from Cook, the Compensation Committee chose to maintain hisMr. Frederico’s salary at $1,250,000 for the 20182019 performance year.
In February 2020, given the continued importance of maintaining Mr. Frederico’s strategic leadership as we seek to transform ourselves in accordance with his vision from a financial guaranty insurance company to a financial services company offering both financial guaranty products and asset management services, but also considering the result of oursay-on-pay vote in 2018 and based on shareholder feedback and advice from Cook, the Compensation Committee chose to again maintain Mr. Frederico’s salary at $1,250,000 for the 2020 performance year. The last increase in base salary Mr. Frederico received was granted in February 2017, effective January 1, 2017.
To determine Mr. Frederico’s cash incentive, as discussed above, under “Executive Compensation Program Structure and Process—Components of Our Executive Compensation Program—Cash Incentive Compensation,” the Compensation Committee used a formula that involved aggregating the weighted achievement scores for certain financial performance goals and individualnon-financial objectives, and multiplying the result by hisMr. Frederico’s Individual Target Cash Incentive Amount. ThePlease refer to the diagram and discussion found above under “Executive Compensation Program Structure and Process—Components of Our Executive Compensation Program—Cash Incentive Compensation.”
Setting Mr. Frederico’s 2019 Financial Performance Goals
In February 2019, the Compensation Committee established targets for five financial performance goals for 2017Mr. Frederico (and for our other executive officers) for the 2019 performance year. The financial performance goals were based on the business plan for the upcoming year that the Board of Directors reviewed and approved in November 2016. 2018 and were designed to measure our progress in creating value for our shareholders. We include on pages 31 to 33 under “Executive Compensation Program Structure and Process—Components of Our Executive Compensation Program” a detailed description of the financial performance goals, and why the Compensation Committee considers them to be important in assessing our Company and our executive officers’ performance. All of these arenon-GAAP financial measures.
The Compensation Committee viewed all of the 2019 targets for the financial performance goals as challenging in light of current market conditions. The target of $325 million the Compensation Committee set for 2019 PVP was nearly 20% higher than our actual 2018 PVP of $272 million when excluding the impact of the SGI reinsurance transaction from 2018 PVP, but was lower than actual 2018 PVP when including the SGI reinsurance transaction. PVP is meant to be a measure of the strength of new business production in our insurance business. The Compensation Committee views the best measure of PVP as one that excludes the impact of strategic transactions such as the SGI transaction, so does not view this as an instance when it should exercise its negative discretion.
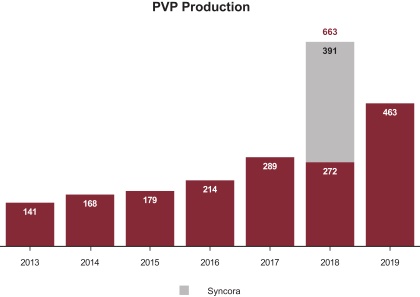
37
The Compensation Committee did set two 2019 targets (core operating income per diluted share and core operating ROE) at levels it viewed as challenging but that were below 2018 comparable results. As described on pages 31 to 32 under “Executive Compensation Program Structure and Process”, the nature of the accounting model for the financial guaranty business, where only approximately 3% of the premiums we earned in 2019 related to new financial guaranty policies we wrote in 2019, shows how little impact activity in our core insurance business has on the two of our financial measures related to income. Absent strategic transactions, and until the asset management business begins contributing more, almost all of our core operating income per diluted share and core operating ROE for a year can be projected at the beginning of the year based on insurance business already originated in prior years. Consequently, the Compensation Committee’s approach to setting goals for these two measures is to project the core operating income per diluted share and core operating ROE for the year based on ourin-force insurance business and goals for PVP production, and then set targets that require management to exceed those projections. When the projections are lower than actual performance for the prior year, as was the case for these two measures for 2019, the resulting goals can be quite challenging while still being below the prior year actual results. The Compensation Committee believes the goals it set in 2019 for these two measures fall in this category. As described below, in accordance with last year’s changes to the executive compensation program and based on shareholder feedback, the Compensation Committee exercised its negative discretion in scoring executive performance against these two measures.
Mr. Frederico’s 2019 Financial Performance Goal Scores
In 2019, we exceeded all of the 2019 targets for the financial performance goals, in some instances substantially.
We generated PVP of $463 million, the highest reported in ten years (when excluding our 2018 reinsurance transaction with SGI), and 70% more than we achieved in 2018 when excluding our 2018 reinsurance transaction with SGI. The achievement is significant in light of our maintaining our underwriting and pricing principles despite the challenging business environment we continue to face; we produced these results while still producing new business that had a higher average internal rating in 2019 than in 2018 and with higher average risk-adjusted premiums in 2019 than 2018.
With core operating income per diluted share of $3.91, we exceeded our goal of $3.30 by 18.5%, although it was still below last year’s actual results.
Core operating shareholders’ equity per share reached its highest level in our history, increasing 9.4% fromyear-end 2018 and exceeding our goal by 0.1%.
We exceeded our goal for core operating ROE by 12.7%, although it was still below last year’s results.
Core adjusted book value, which we refer to as Core ABV, per share increased by 12.4% and reached its highest level in our history, propelled by our efficient management of capital and the generation of PVP.
We achieved these results despite a persistently challenging business environment.
Over the last several years, municipal bond yields have been at historically low levels and credit spreads have been tight, making our product less attractive to issuers. Interest rates and credit spreads remained low in 2019 by historical standards.
We continued to face competition in an already tight market from a second financial guaranty insurer that focuses on a smaller portion of the market than we do and provides price competition in those markets where we overlap.
Despite the strides we have made in managing our capital, we believe we still have excess capital that we need regulatory approval to deploy, and therefore are constrained in our ability to improve our capital efficiency and core operating ROE. See “Summary – 2019 Achievement Highlights” on page 23.
The Compensation Committee assigned Mr. Frederico achievement scores for his achievements against each individual financial performance goal. In three instances, we achieved results substantially in excess of the 2019 financial performance goals established by the Compensation Committee in November 2018, but below the actual results for 2018. In the first instance, PVP, our result was well in excess of PVP in 2018 excluding the SGI portfolio reinsurance transaction. PVP is meant to be a measure of the strength of new business production in our insurance business, and the Compensation Committee does not consider the 2018 portfolio reinsurance transaction with SGI to be typical new business origination. Because our 2019 PVP was well in excess of our 2018 PVP excluding the SGI portfolio reinsurance transaction, the Compensation Committee chose not to treat the 2019 result as a result below the prior year actual result. In the other two instances, the Compensation Committee exercised its negative discretion to reduce how it would have scored the 2019 result relative to the goal if the 2019 result had not been lower than the 2018 result.
Our core operating income per diluted share exceeded the 2018 goal by nearly 20%, so probably would have been scored between 115% and 130%, depending on the circumstances; the Compensation Committee exercised its negative discretion to reduce the score to 105% in light of the actual 2018 Core operating income per diluted share of $4.37.
Similarly, our Core operating ROE exceeded the 2018 goal by nearly 13%, so probably would have been scored between 110% and 120%, depending on the circumstances; the Compensation Committee exercised its negative discretion to reduce the score to 100% in light of the actual 2018 core Operating ROE of 7.6%.
38
The Compensation Committee weighted Mr. Frederico’s financial performance goal scores in accordance with the cash incentive formula, which resulted in a weighted financial performance goal score of 83.1%:
2019 CEO Financial Performance Scorecard
| 2019 Targets | 2019 Results | Weighting | 2019 Achievement Score (0%-200%) | Weighted Achievement Score | ||||||||||||||||
Financial Performance Goals* | ||||||||||||||||||||
PVP | $ 325 million | $463 million | 13.4% | 170 | % | 22.8% | ||||||||||||||
Core operating income per diluted share | $3.30 | $3.91 | 13.4% | 105 | %** | 14.1% | ||||||||||||||
Core operating shareholders’ equity per share | $66.84 | $66.89 | 13.4% | 110 | % | 14.7% | ||||||||||||||
Core operating ROE | 5.5% | 6.2% | 13.4% | 100 | %** | 13.4% | ||||||||||||||
Core ABV per share
|
| $94.91
|
|
| $96.91
|
|
| 13.4%
|
|
| 135
| %
|
| 18.1%
|
| |||||
Total Financial Performance Goal Score
|
| 67.0%
|
|
| 83.1%
|
| ||||||||||||||
Mr. Frederico’sNon-Financial Objectives
The Compensation Committee also evaluated Mr. Frederico’s 2019 achievements against his 2019non-financial objectives. Highlights of those achievements include the transformational acquisition of BlueMountain and the establishment of Assured Investment Management; achievement of the highest level of PVP since the financial crisis; and the prominent role our Company continues to assume in the restructuring of the debt of Puerto Rico and its related authorities and public corporations. The details of Mr. Frederico’s 2019 achievements against his 2019non-financial objectives were established taking into accountare set out in the naturepages that follow.
| Non-Financial Objectives | 2019 Results | |
Financial Guaranty Business—Articulate clear strategy and lead effective implementation of business plan to grow direct business and take advantage of reinsurance opportunities • Expand U.S. public finance financial guaranty business (municipal and infrastructure) bond insurance market • Expandnon-U.S. infrastructure financial guaranty business • Expand global structured financial guaranty business • Attempt to purchase bond insurance portfolios if they become available | • Under our CEO’s leadership, we wrote a total of $463 million of PVP, which constituted 142% of our 2019 target and 170% of our 2018 results when excluding the SGI portfolio reinsurance transaction ◾ U.S. public finance PVP of $201 million ◾ International PVP of $211 million ◾ Structured finance PVP of $51 million • Production highlights include: ◾ a number ofsub-sovereign credits in Europe ◾ $700 million of par insured for CommonSpirit Health, the largest insured transaction in nearly a decade ◾ producing these results while still producing new business that had a higher average internal rating in 2019 than in 2018 and with higher average risk-adjusted premiums in 2019 than 2018 | |
| * | All of the financial performance goals are based onnon-GAAP financial measures, which are described on page 52 under“Non-GAAP Financial Measures.” |
| ** | The Compensation Committee exercised its negative discretion with respect to these two achievement scores. |
39
| Non-Financial Objectives | 2019 Results | |
Active Loss Mitigation and Avoidance—Proactively manage financial guaranty portfolio to identify and avoid losses when stress develops and minimize losses when losses cannot be avoided • Use all available levers to creatively resolve Puerto Rico credits while minimizing losses to the Company | Puerto Rico: • Successfully prosecuting the Appointments Clause appeal to the First Circuit, where the First Circuit overturned the Title III Court’s prior decision and held that PROMESA’s procedure for selecting board members is unconstitutional because it violates the Appointments Clause of the U.S. Constitution • Reaching agreement with PREPA and the Oversight Board on a restructuring support agreement that provides for a favorable economic treatment of the Company’s insured PREPA bonds • Successfully completing the restructuring of the Company’s insured COFINA bonds, culminating with confirmation of the COFINA plan of adjustment in February and sale of the COFINA exchange bonds in September Outside Puerto Rico: • Effectuating the restructuring of an insurance securitization transaction, resulting in the receipt of cash proceeds for bonds held by the Company and an overall reduction of its remaining exposure, and increasing excess rating agency capital | |
Diversification—Articulate clear strategy and lead effective implementation of diversification strategy to increasenon-financial guarantyfee-based financial services business | • Identified BlueMountain as the best asset manager to purchase to establish Assured Investment Management • Instrumental in negotiating terms and conditions of, and closing, the acquisition of BlueMountain and in providing crucial leadership during the integration of BlueMountain into our Company | |
Capital Management—Articulate clear strategy to maintain optimal capital structure, considering internal risk measures and rating agency and regulatory requirements • Accumulate capital outside of insurance companies to support diversification and other strategies • Return excess capital to shareholders | • Repurchased $500 million of common shares and paid $74 million in dividends while still funding the acquisition of BlueMountain and the payment of Puerto Rico claims • Funded the BlueMountain acquisition and related investments with excess capital from our insurance subsidiaries • Obtained regulatory approval for a special dividend of $100 million from one insurance subsidiary and the repurchase of $100 million of stock by another insurance subsidiary | |
Regulatory—Maintain optimal corporate and regulatory structure and good standing to pursue the articulated business strategies | • Established a French insurance subsidiary in 2019 to service existing exposure and write new business on the European continent after Brexit | |
Financial strength ratings—Maintain strong financial strength ratings at insurance companies to facilitate articulated business strategies • Periodically assess the financial strength ratings of each company in the group to determine whether to request that a rating agency add or drop a rating from that company | • All financial strength ratings maintained • Obtained AA+ Kroll Bond Rating Agency rating and AA S&P rating for new French insurance subsidiary • Successfully worked with rating agencies to minimize impact on rating agency capital of new initiatives in asset management and public finance originations | |
40
| Non-Financial Objectives | 2019 Results | |
Risk Management—Ensure that the Company has comprehensive, best-practice risk management with respect to all of its activities • Insure credits of good quality consistent with underwriting guidelines and consistent with risk appetite statement • Articulate and execute thorough enterprise risk management program | • Consistently maintained a strong compliance culture with leadership from the top—our enterprise risk management has consistently been commended, including by rating agencies • Emphasized adherence to our underwriting guidelines and single risk limits even in the face of market and competitive pressures • Provided leadership from the top with respect to environmental and social matters, encouraging our Board to establish a separate Environmental and Social Responsibility Committee and causing the formal incorporation of environmental and climate considerations into our financial guaranty insurance underwriting process | |
Operations—Establish an environment of excellence in all areas of operations, including investment management, accounting and financial reporting, and legal and compliance, and provide a secure information technology environment | • Maintained an environment of excellence in all areas of our operations by continually evaluating, and encouraging senior management to evaluate, our processes and procedures. • Improvements this year include: ◾ Providing additional training to employees ◾ Putting into production a first phase of a new subledger system ◾ Began integration of BlueMountain | |
Management development and succession planning—Attract and retain top quality senior management; develop succession plan for critical positions, including assisting the Board in further development of a CEO succession plan | • Reviewed CEO succession plan with Board of Directors • Actively worked to integrate and retain senior members of the BlueMountain team | |
Based on Mr. Frederico’s 2019 achievements against his 2019non-financial objectives, the Compensation Committee awarded him an achievement score of our business, which requires qualitative goals200% against those objectives. Applying that score to fully evaluate the annual achievementscash incentive formula resulted in a weightednon-financial objective score of 66%.
41
The Compensation Committee then added that benefit our shareholders.weightednon-financial objective score of 66% to the weighted financial performance goal score of 83.1% achieved by Mr. Frederico as described earlier, to derive a total achievement score of 149.1% in accordance with the cash incentive formula, as follows:
Summary 2019 CEO Performance Scorecard
| Weighting | 2019 Achievement Score (0%-200%) | Weighted Achievement Score | ||||||||||
Total Financial Goal Score (Summarized on page 39 above.) |
| 67% |
|
| 83.1% |
| ||||||
Non-Financial Objectives | ||||||||||||
Financial Guaranty Business—Articulate clear strategy and lead effective implementation of business plan to grow direct business and take advantage of reinsurance opportunities |
| 33% |
|
| 200% |
|
| 66.0% |
| |||
Active Loss Mitigation and Avoidance | ||||||||||||
Diversification—Articulate clear strategy and lead effective implementation of diversification strategy | ||||||||||||
Capital Management | ||||||||||||
Regulatory | ||||||||||||
Financial strength ratings | ||||||||||||
Best practice risk management | ||||||||||||
Operations | ||||||||||||
Management development and succession planning | ||||||||||||
Non-Financial Objective Score |
| 33% |
|
| 66% |
| ||||||
Achievement Score |
| 149.1% |
| |||||||||
| * | All of the financial performance goals are based onnon-GAAP financial measures, which are described on page 52 under“Non-GAAP Financial Measures.” |
In reviewing Mr. Frederico’s 20172019 performance scorecard, the Compensation Committee determined that he had a very strong year. In particular, the Compensation Committee found that Mr. Frederico should be recognized for our success in exceeding all but one of the targets for the financial performance goals established by the Compensation Committee, in certain cases substantially, and also noting that, ifeither (a) the price of our Common Shares had not increased in the middle of the year and we had been able to repurchase the number of Common Shares we originally projected we would with $500 million,or (b) if it had not been for the 2017 Tax Act (which was adopted well after the goals were established), we would have exceeded all of our financial performance goals.substantially. Mr. Frederico’s very strong performance was reflecteddemonstrated by our $463 million of PVP production, the highest reported in ten years (when excluding our record core operating shareholders’ equity per share and core adjusted book value per share of $56.17 and $77.86, respectively.2018 portfolio reinsurance transaction with SGI). Mr. Frederico’s leadership and vision was also credited for the growth indriving force behind our new business production, with contributions from our U.S. public finance, international infrastructure and global structured finance businesses, despite a challenging business and economic environment.
34
The Compensation Committee assigned Mr. Frederico achievement scores for his achievements against each individual financial performance goal, which averaged 125% acrossestablishment of Assured Investment Management through the five goals. The Compensation Committee’s rationale for establishing these 2017 financial performance goals in February 2017 is discussed on pages 23-24 of “Compensation Discussion and Analysis — Summary — 2017 Results Against Targets”. The Compensation Committee weighted this score 67% in accordance with the cash incentive formula, which resulted in a weighted score of 83.8%:
| 2017 Targets | 2017 Results | Weighting | 2017 Achievement Score (0%-200%) | Weighted Achievement Score | ||||||||||||||||
Financial Performance Goals*
| ||||||||||||||||||||
PVP | $ 260 million | $289 million | 13.4% | 110% | 14.7% | |||||||||||||||
Core operating income per diluted share | $3.23 | $5.31 | 13.4% | 140% | 18.8% | |||||||||||||||
Core operating shareholders’ equity per share | $56.52 | $56.17 | 13.4% | 95% | 12.7% | |||||||||||||||
Core operating ROE | 6.2% | 10.1% | 13.4% | 140% | 18.8% | |||||||||||||||
Core ABV per share
|
| $74.22
|
|
| $77.86
|
|
| 13.4%
|
|
| 140%
|
|
| 18.8%
|
| |||||
Total Financial Goal Score
|
| 67%
|
|
| 83.8%
|
| ||||||||||||||
35
The Compensation Committee also evaluated Mr. Frederico’s 2017 achievements against his 2017non-financial objectives. Highlights of those achievements include the positive financial impact from our acquisition of MBIA UK; the positive impact fromBlueMountain and associated entities. Importantly, our reassumption of previously ceded portfolios; achievement of the highest level of PVP since 2010;TSR has reflected these strides: ourone-year TSR for 2019 was over 30% and the prominent role our Company continues to assume in the restructuring of the debt of Puerto Rico and its related authorities and public corporations. The details of Mr. Frederico’s 2017 achievements against his 2017non-financial objectives are set out in the pages that follow.five-year TSR for 2015 through 2019 was over 105%.
|
| |
36
|
| |
|
| |
|
| |
|
| |
|
| |
37
Based on Mr. Frederico’s 2017 achievements, against his 2017non-financial objectives, the Compensation Committee awardedgave him an achievement score of 185% against those objectives. Applying that score to the cash incentive formula resulted in a weightednon-financial objective score of 61%.
The Compensation Committee then added the weightednon-financial objective score of 61% to the weighted financial performance goal score of 83.8% achieved by Mr. Frederico, to derive a total achievement score of 144.8% in accordance with149.1% for the cash incentive formula, as follows:
2017 Targets
| 2017 Results
| Weighting
|
2017
| Weighted
| ||||||
Financial Performance Goals* | ||||||||||
PVP | $ 260 million | $289 million | 13.4% | 110% | 14.7% | |||||
Core operating income per diluted share | $3.23 | $5.31 | 13.4% | 140% | 18.8% | |||||
Core operating shareholders’ equity per share | $56.52 | $56.17 | 13.4% | 95% | 12.7% | |||||
Core operating ROE | 6.2% | 10.1% | 13.4% | 140% | 18.8% | |||||
Core ABV per share | $74.22 | $77.86 | 13.4% | 140% | 18.8% | |||||
Total Financial Goal Score | 67% | 83.8% | ||||||||
Non-Financial Objectives | ||||||||||
Strategy and leadership | Described in detail in the preceding table | Described in detail in the preceding table | 33% | 185% | 61.0% | |||||
Active management of all potential | ||||||||||
Maintain current ratings for operating insurance company subsidiaries | ||||||||||
Best practice risk management | ||||||||||
Management development and | ||||||||||
Non-Financial Objective Score | 33% | 61.0% | ||||||||
Achievement Score | 144.8% | |||||||||
Based on Mr. Frederico’s achievements, but also considering our negativeone-year TSR, after applying2019 performance year, slightly below his achievement score for the cash incentive formula, the Compensation Committee awarded him a cash incentive equal2018 performance year. Applying this achievement score to 144.8% of his Individual Target Cash Incentive Amount or $4,525,000, which is approximatelyresulted in a cash incentive award of $3,727,000. This was $85,000 (or 2.2%) less than the same amount as$3,812,000 awarded to Mr. Frederico for the prior2018 performance year.
The Compensation Committee awarded all of Mr. Frederico’s long-term incentive compensation in the form of performance share unitsPSUs and RSUs. The $5,750,000$6,750,000 target nominal amount of long-term equity constituted a $250,00012.5% increase over the target nominal amount for the prior year. The Compensation Committee believed the amountit was appropriatevery important to reward Mr. Frederico for his and for our Company’s very strong performance during 2017.2019, particularly the execution of a transformative acquisition that will diversify our revenue by supplementing the risk premiums we receive in our insurance segment with fee income. It also reflected the Compensation Committee’s desire that Mr. Frederico have a strong incentive to remain atcontinue his valued leadership of our Company and to generate long-term, sustained growth that will enhance shareholder value as we work to establish Assured Investment Management in the asset management business while growing our insurance business, and its consideration of an appropriate level of total compensation for Mr. Frederico.so becoming the diversified financial services company that he envisions.
The following table sets forth the target nominal amount of long-term incentive compensation the Compensation Committee awarded Mr. Frederico on February 21, 2018,26, 2020, the grant date. The Compensation Committee determined the number of performance share unitsPSUs and RSUs to award Mr. Frederico by converting the target nominal amount of the award using $34.96,$47.36, which was the average share price of our Common Shares over the 40 consecutive trading days ending on February 21, 2018.26, 2020.
42
When we prepare the Summary Compensation Table, we report the value of the grants using U.S. generally accepted accounting principles (which we refer to as U.S. GAAP), in accordance with the SEC’s rules.
Under U.S. GAAP, the value of an ABV PSU as of February 26, 2020 was determined to be $43.09. This value is based on the closing price of our Common Shares on that date, which U.S. GAAP allows as a practical expedient to value grants with complicated features, such as in this case the estimated growth rate of the Company’s Core ABV per share.
Under U.S. GAAP, the value of a performance share unit as ofRelative TSR PSU on February 21, 201826, 2020 was $45.64,$38.96. This value was computed using a Monte-Carlo simulation model valuetaking into account the historical relationship of our TSR and the highest average share price
38
over 40 consecutive trading days, where the sequence of 40 days occurs in the second halfTSR of the 2018-2020Index, including for the period from the beginning of the Relative TSR PSU performance period. period to February 26, 2020, the grant date. We engaged Aon to provide this computation for us.
Under U.S. GAAP, the value of an RSU was $37.85, computed using$43.09, based our Common Share closing price on February 21, 2018, adjusted for the delay in the payment of dividends until vesting. 26, 2020.
The aggregate value of theMr. Frederico’s February 2020 long-term equity incentive grants under U.S. GAAP is also set forth below.
Compensation Committee Target
|
Equity
| U.S. GAAP
| ||||||||||||||||||||||
Performance share units | $2,875,000 | 82,237 | $ | 3,753,297 | ||||||||||||||||||||
Compensation Committee Target
| Equity
| U.S. GAAP
| ||||||||||||||||||||||
ABV PSUs |
| $2,025,000 |
|
| 42,758 |
| $ | 1,842,442 |
| |||||||||||||||
Relative TSR PSUs |
| $2,025,000 |
|
| 42,758 |
| $ | 1,665,852 |
| |||||||||||||||
RSUs | $2,875,000 | 82,237 | $ | 3,112,670 |
| $2,700,000 |
|
| 57,010 |
| $ | 2,456,561 |
| |||||||||||
TOTAL | $5,750,000 | $ | 6,865,967 |
| $6,750,000 |
|
| 142,526 |
| $ | 5,964,855 |
| ||||||||||||
The Compensation Committee considered the total compensation it was awarding to Mr. Frederico pursuant to its formulas and methodologies in light of Mr. Frederico’s considerable accomplishments with respect to the financial performance goals, especially the amount of PVP achieved, as well as hisnon-financial objectives, butespecially the establishment of Assured Investment Management, while also taking into account our negativeone-year TSR. The Compensation Committee attributed the disappointingone-year TSR result primarily to developments related to Puerto Rico, including the impact of the landfall of Hurricane Maria, which the committee acknowledged were outside Mr. Frederico’s control. shareholder feedback and advice from Cook.
The Compensation Committee concluded that in light of our negativeone-year TSR result, it was appropriate that Mr. Frederico’s individual cash incentive of $4,525,000be $3,727,000 for 2017 and base salary for 2018 remained largely unchanged (his cash incentive for 2017 was only 0.6% higher than his cash incentive for 2016 and his 2018 base salary is the same as his base salary for 2017). However, the Compensation Committee did give Mr. Frederico credit for consistently accomplishing our strategies successfully over the last several years, including the 20172019 performance year, so as to achieve high three- and five-year TSR results. $85,000 less than 2018. This decrease reflected the slight decrease in Mr. Frederico’s scorecard for his financial performance goals, mitigated somewhat by a higher score for hisnon-financial objectives.
The Compensation Committee also considered the importance of maintaining Mr. Frederico’s leadership of our Company in the years ahead as we seek to continue developing both our financial guaranty business to diversify into areas that complementand our core credit experience and risk appetite, tonewly established asset management business, manage our insured exposure and mitigate any losses in the insured portfolio, and to manage our capital. capital, and as a result increased Mr. Frederico’s long-term equity compensation by $750,000 in targeted nominal value.
Taking these various factors into account, the Compensation Committee believed it was also appropriate for Mr. Frederico’s total 20172019 compensation, which it determined in accordance with its formulas and methodologies, to be 3.4%6% higher than his total 20162018 compensation.
CEO Reported Pay Versus Realized Pay
To supplement the disclosure in the Summary Compensation Table on page 50, which is determined under SEC rules, we have included the table below, which shows the difference between Mr. Frederico’s compensation as reported in the Summary Compensation Table and the compensation he actually received over the relevant period.
The primary source of the difference between the Summary Compensation Table Reported Value and the Actual Realized Value was Mr. Frederico’s equity grants. Under the SEC’s rules, the Summary Compensation Table for a given year must disclose the grant date value of an executive officer’s long-term equity incentive compensation granted in that year. However, equity grants constitute an incentive for future performance, not current cash compensation, and will not actually be received by the executive officer until a future year, if at all. Moreover, the value of this pay when realized may differ significantly from the grant date value shown in the Summary Compensation Table.
CEO Total Compensation
| ||||||||||||||||
Year
| Summary
| Actual Realized
| Variation Between
| % Difference
| ||||||||||||
2017 | $13,526,784 | $15,969,451 | $2,442,667 | 18% | ||||||||||||
2016 | $12,727,315 | $8,536,728 | -$4,190,587 | -33% | ||||||||||||
2015 | $12,179,989 | $15,395,726 | $3,215,737 | 26% | ||||||||||||
39
OTHER NAMED EXECUTIVE OFFICER COMPENSATION DECISIONS
Non-Financial Objectives and Achievements of the Other Named Executive Officers
The Compensation Committee made compensation awards to the other executive officers for the 20172019 performance year based on its assessment of their achievements and Mr. Frederico’s review of their performance, as well as Mr. Frederico’s compensation recommendations. The other named executive officers’ achievements were evaluated based on their contributions to our achievement of our financial goals, their contributions to the achievement of Mr. Frederico’snon-financial objectives, and their own achievements of the individualnon-financial objectives Mr. Frederico had assigned to them, as described below.
Robert A. Bailenson, Chief Financial Officer
Mr. Bailenson was responsible in the 20172019 performance year for meeting all internal and external financial requirements, managing our capital efficiently, meeting with investors, and participating on earnings calls. In 2017 Mr. Bailenson assumed responsibility forhas involved himself in all aspects of our investor relations group.business and leads the financial team in addressing market and regulatory changes. More specifically, Mr. Bailenson:
Contributed to the negotiation and developed a planacquisition of BlueMountain;
Successfully mobilized capital to managesupport our outstanding debt;
43
Managed from the user side the planning and deployment of phase 1 of our new insurance accounting subledger application and extended our data warehouse to provide sufficient funds atthe necessary financial reporting;
Worked with our holding companyrating agencies and investment managers to meet our goals for repurchasesbroaden the categories of our Common Sharesinvestments;
Actively participated in 2017;
Was responsible for the timely and accurate filing of all financial statements.statements and tax returns.
James M. Michener,Ling Chow, General Counsel
Mr. Michener was responsible inMs. Chow has been an effective leader of legal resources for our Company. Her work on the 2017 performance yearestablishment of our new French insurance company, financial disclosures, litigation and planning and strategy is exemplary. She has also provided excellent and timely counsel to our company on various internal matters. More specifically, Ms. Chow:
Developed the regulatory strategy and structure for our acquisition of BlueMountain and helped lead the due diligence and negotiation of terms and documentation for the acquisition;
Initiated and is leading the process of developing the legal structure and guidelines for the integration of the highly regulated asset-management business with Assured Guaranty andre-branding it “Assured Investment Management”;
Successfully led the effort to obtain a number of important initiatives,regulatory approvals, including developing litigation strategy relatingapprovals for various actions that had the effect of increasing the resources available for strategic priorities of our holding company;
Provided support and guidance to our Compensation Committee in restructuring our executive compensation program in response to thesay-on-pay results in 2018, resulting in 93%say-on-pay approval in 2019;
Oversaw the Legal Department’s contribution to our efforts to mitigate Puerto Rico and managing litigation and workout activities relating to a number of distressed structured finance and U.S. public finance credits; developing the optimal structure from a regulatory perspective of a number of alternative investments; and obtaining regulatory approval of several significant matters that enabled us to manage our capital more efficiently. He also oversaw all of our human resource matters. More specifically, Mr. Michener:losses, including numerous legal actions;
Oversaw legal support and oversaw litigation strategy relatinganalysis for all underwriting activity;
Oversaw all disclosure activities; and
Supervised our response to our Puerto Rico exposure;
Mr. Michener resignedprivacy as our General Counsel and Secretary, effective December 31, 2017, in accordance with the terms of a separation agreement described under “Compensation Discussion and Analysis–Separation Agreement”. Mr. Michener remains employed by our Company in a non-executive officer position, servingwell as the Senior Advisor to the Chief Executive Officerrising prominence of the Company.environmental, social and governance issues.
Russell B. Brewer II, Chief Surveillance Officer
Mr. Brewer was responsible in the 20172019 performance year for ensuring that all of our insured exposures are reviewed annually and assigned appropriate internal ratings, for managing loss mitigation strategies for our troubled credits, and for overseeing our information technology department. Mr. Brewer also managesis a major contributor to the successful operations of our company and is a thought leader in our relationships with our rating agency relationships.agencies. More specifically, Mr. Brewer:
Led the surveillance process for our $265$237 billion net par insured portfolio and the timely review and update of internal ratings for our insured portfolio, helping to identify and intervene in deteriorating situations before losses developed to avoid losses altogether or mitigate them if they cannot be avoided;
Oversaw the smooth updateand participated in many of the software platform for our exposure systems while maintaining functionality;risk mitigation activities, including making major contributions to our effort in Puerto Rico;
Oversaw the successful defense of our systems from headline cyberattacks and our compliance with new cybersecurity regulations;
Managed the successful implementation of phase 1 of our new insurance accounting subledger application and implemented strategies on a numberextended our data warehouse to provide the necessary financial reporting;
Successfully worked with rating agencies to minimize impact of transactions where we are experiencing loss or could possibly experience loss;
Initiated and is leading the Commonwealthprocess of Puerto Rico and its advisors and was instrumental in helping the Company develop its approach to these credits; and
40technology systems.
Bruce E. Stern, Executive Officer
Mr. Stern was responsible in the 20172019 performance year for workouts of troubled transactions and the extraction of significant value from our insured portfolio and other relationships. Mr. Stern applied creative approaches to troubled transactions to mitigate losses. Mr. Stern is also responsible for governmental affairs and our participation in an industry group. More specifically, Mr. Stern:
Was deeply involved in our efforts to mitigate losses in Puerto Rico, playing a particularly valuable role in advocating our viewpoint to various government officials;
Made significant progress in resolving two distressed insurance transactions; and
44
Executed reinsurance commutations and risk remediation;
Mr. Stern resigned as our Executive Officer, and we eliminated the position of Executive Officer, effective December 31, 2019, in accordance with the terms of a separation agreement described under “Compensation Discussion and Analysis—Other Named Executive Officer Compensation Decisions—Separation Agreement” on page 46 below. Mr. Stern remains employed by purchasing insured bondsour Company in anon-executive officer position, serving as the open market and procuringSenior Advisor to the terminationChief Executive Officer of financial guaranty insurance executed in credit default swap form; and
Compensation Decisions for the Other Named Executive Officers
In the case of the other named executive officers, for the 20172019 performance year the Compensation Committee calculated and aggregated the weighted achievement scores for the financial performance goals (which were the same as Mr. Frederico’s) and theirnon-financial objectives (which were a combination of their contribution to Mr. Frederico’snon-financial objectives and their achievement of their own individualnon-financial objectives), taking into account the level of difficulty of achieving particular goals or objectives. Based on their achievements, after applying the formula, the Compensation Committee awarded them the cash incentives calculated as shown in the table below.
(
| 2017 Salary
| X
| 2017 Individual Target Incentive Multiple
| )
| X
| (
| Financial Achievement Score (weighted 67%)
| +
| Individual Financial Achievement (weighted 33%)
| )
| =
| 2017 Cash Incentive Payout
| (
| 2019 Salary
| X
| 2019 Individual Target Incentive Multiple
| )
| X
| (
| Financial Achievement Score (weighted 67%)
| +
| Individual Financial Achievement (weighted 33%)
| )
| =
| 2019 Cash Incentive Payout
| |||||||||||||||||||||||||||||||||||||||||||||||||||
Robert A. Bailenson | $ | 625,000 | 2.00x | 83.8% | 54.0% | $ | 1,728,125 | $ | 700,000 |
|
| 2.00x |
|
| 83.1% |
|
| 59.4% |
| $ | 1,994,720 |
| ||||||||||||||||||||||||||||||||||||||||||||||||||||||
James M. Michener | $ | 625,000 | 2.00x | 83.8% | 54.0% | $ | 1,728,125 | |||||||||||||||||||||||||||||||||||||||||||||||||||||||||||||||||||||
Russell B. Brewer II | $ | 500,000 | 2.00x | 83.8% | 66.0% | $ | 1,498,000 | $ | 525,000 |
|
| 2.00x |
|
| 83.1% |
|
| 64.4% |
| $ | 1,548,015 |
| ||||||||||||||||||||||||||||||||||||||||||||||||||||||
Ling Chow | $ | 525,000 |
|
| 2.00x |
|
| 83.1% |
|
| 56.1% |
| $ | 1,461,390 |
| |||||||||||||||||||||||||||||||||||||||||||||||||||||||||||||
Bruce E. Stern | $ | 470,000 | 2.00x | 83.8% | 33.0% | $ | 1,097,920 | $ | 500,000 |
|
| 2.00x |
|
| 83.1% |
|
| 39.6% |
| $ | 1,227,800 |
| ||||||||||||||||||||||||||||||||||||||||||||||||||||||
The Compensation Committee awarded all of the other named executive officers’officers, other than Mr. Stern, long-term incentive compensation in the form of performance share unitsPSUs and RSUs.RSUs with the same terms and in the same proportion as the PSUs and RSUs awarded to Mr. Frederico. The target nominal amount of long-term equity reflected the Compensation Committee’s desire that each of the other named executive officers have a strong incentive to help generate long-term, sustained growth for our Company. The amounts of performance share unitsPSUs and RSUs awarded to each other named executive officer vary by individual and are based on their respective positions and levels of responsibility, historic compensation levels and Cook’s advice about the compensation practices of companies in our comparison group. In accordance with and subject to compliance with the terms of his separation agreement, Mr. Stern will be awarded deferred cash in lieu of PSUs and RSUs.
The Compensation Committee considered Cook’s analysis of the compensation paid to named executive officers in our executive compensation comparison group when evaluating the compensation of our executive officers. (Our revised comparison group is described under “Compensation Governance—Executive Compensation Comparison Group on page 48 below.) According to Cook, for the 20162018 performance year, which is the most recent data available, on average, the target total direct compensation for our named executive officers approximatedranked between the comparable median toand 75th percentile of amounts for the named executive officers of our revised executive compensation comparison group, reflecting the experience, leadership, specialized skill sets and sustained performance of theour senior executive team. Actual total direct compensation for theour named executive officers as a group paid for the 20162018 performance year was nearalso between the median and 75th percentile of our revised executive compensation comparison group, reflecting our above target bonus payouts for 20162018 performance, which were aligned with our 20162018 performance relative to our key business goals and strategies, as well as our strong financial performance for that period and our three-year total shareholder returns relative to our previous comparison group during that period.group. For the 20162018 performance year, ourone-year growth in book value was the highest in our comparison groupbetween median and our return on average equity as well as one-year growth in operating income were both above the 75th percentile of our revised executive compensation comparison group, while one-year growth in net income and growth in diluted earnings per share approximatedconsistent with the medianranking of our comparison group. Also for the 2016 performance year our one-year TSR was above the 75th percentileactual total direct compensation, and ourone-year and three-year TSR at the end of 2018 was in the highest intop quartile of our executive compensation comparison group.
4145
In summary, the Compensation Committee approved the following compensation decisions for the named executive officers other than Mr. Frederico for the 20172019 performance year:
Robert A.
| James M.
| Russell B.
| Bruce E.
| Robert A. Bailenson | Russell B. Brewer II | Ling Chow | Bruce E. Stern | |||||||||||||||||||||||||
Fixed Compensation—Base Salary(1) | $625,000 | $625,000 | $500,000 | $470,000 |
| $700,000 |
|
| $525,000 |
|
| $525,000 |
|
| $500,000 |
| ||||||||||||||||
Incentive Compensation | ||||||||||||||||||||||||||||||||
Cash Incentive Compensation | $ | 1,728,125 | $ | 1,728,125 | $ | 1,498,000 | $ | 1,097,920 | $ | 1,994,720 |
| $ | 1,548,015 |
| $ | 1,461,390 |
| $ | 1,227,800 |
| ||||||||||||
Long-Term Performance-Based Equity and Time-Based Equity Target Values(2) | $ | 1,500,000 | $ | 1,000,000 | $ | 1,100,000 | $ | 800,000 | ||||||||||||||||||||||||
Long-Term Equity Incentive Target Values(2) | $ | 1,500,000 |
| $ | 1,150,000 |
| $ | 1,150,000 |
| $ | 700,000 |
| ||||||||||||||||||||
Total Direct Compensation | $ | 3,853,125 | $ | 3,353,125 | $ | 3,098,000 | $ | 2,367,920 | $ | 4,194,720 |
| $ | 3,223,015 |
| $ | 3,136,390 |
| $ | 2,427,800 |
| ||||||||||||
| (1) | These base salaries were set by the Compensation Committee in February |
| (2) | The long-term equity incentive awards were allocated similarly to Mr. |
The Compensation Committee also decided to increase the base salary of Mr. Bailenson from $700,000 to $800,000 and Ms. Chow from $525,000 to $550,000. Both of their base salaries of three of the named executive officers other than Mr. Frederico based on theirwere increased roles and responsibilities.
industry. The Compensation Committee believed thatbelieves it wasis critical for both of these three executive officers to remain highly motivated in 2018,2020, especially in light of the demands it anticipates will be made on them in connection with the consummationintegration of the reinsurance transaction with SGI, continued focus on developments in Puerto RicoBlueMountain and potential additional alternative investment activity.
our desire to grow Assured Investment Management. The 2018 base salary of Mr. Michener,Brewer will remain the same in 2020, as will the base salary of Mr. Stern, who resigned as our Executive Officer December 31, 2019, but remains employed as theour Senior Advisor to the Chief Executive Officer of our Company through December 31, 2018, like Mr. Frederico’s 2018 base salary, remains the same as it was in 2017.until May 1, 2020.
As furtherpreviously disclosed in our quarterly reportForm8-K filing on Form10-Q for the quarter ended September 20, 2017,January 7, 2020, Mr. MichenerStern resigned as the General Counsel and SecretaryExecutive Officer and as an executive officer of AGL, effective December 31, 2017,2019, in accordance with the terms of a separation and release agreement, which we refer to as the Separation Agreement, which hebetween Mr. Stern and us. We are eliminating the Company entered into on November 1, 2017. The Companyposition of Executive Officer and entered into the Separation Agreement with Mr. Stern in recognition of Mr. Michener’shis successful years of service with the Companyat our company and to encourage him to work through December 31, 2018May 1, 2020 in order to facilitate the transition of his duties to his successor, to advise the Company regarding ongoing litigation (including both litigation against, and litigation commenced by, the Company),other persons in our company, and to have him otherwise remain availablecontinue to consult on matters related to his experience with the Company.work toward closing a potential transaction in which he is involved. The Compensation Committee consulted with Cook and considered its advice with respect to the terms of the Separation Agreement with Mr. Michener.Stern.
Pursuant to the Separation Agreement, Mr. MichenerStern remains employed by our Company in anon-executive officer position, serving as the Senior Advisor to the Chief Executive Officer of the Company, for a transition period, which we refer to as the Transition Period, that began on January 1, 20182020 and ends upon his retirement on December 31, 2018,May 1, 2020, which we refer to as the RetirementTermination Date.
The Separation Agreement provides that iffor the following payments to Mr. MichenerStern:
Mr. Stern received anon-equity incentive payment for the 2019 performance year in March 2020 of $1,227,800, the same amount he received as anon-equity incentive payment for the 2018 performance year in March 2019.
If Mr. Stern remains employed thoughthrough the RetirementTermination Date, his base salary and cash and equity incentive opportunities during the Transition Periodhe will be equalcontinue to receive his current base salary of $500,000 per annum through May 1, 2020.
If Mr. Stern remains employed through the Termination Date, he will receive a cash payment of $700,000 between February 1, 2021, and cash andMarch 15, 2021, in lieu of receiving any long-term equity grant for the 2019 performance year; in March 2019 he had received a long-term equity incentive opportunities. The portiongrant with a target value of $700,000.
If Mr. Stern remains employed through the Termination Date, within 60 days of his separation he will receive a singlelump-sum payment of $2,104,631, which is the severance payment he is entitled to receive pursuant to our executive severance plan as the result of the 2018 incentive award amount, if any, attributable to an equity grant will be paid in cash, 50% in 2019 and the remaining 50% in 2020. elimination of his position.
If Mr. MichenerStern remains employed thoughthrough the RetirementTermination date and a certain transaction on which he has been working is consummated on or prior to May 1, 2021, Mr. Stern will receive an additional $500,000 during 2021 no later than May 31, 2021.
If Mr. Stern remains employed through the Termination Date, any unvested equity awards that he holds onwill become fully vested in the Retirement Date will vestRSUs he was previously awarded and vestedpro-rata in accordance with the terms of the original applicable award agreement for retirement. However, anyPSUs he was previously granted cash and equity awards, including the performance share units granted to Mr. Michener in 2016 and 2017, that include Company or individual performance-based vesting conditions (e.g., the achievement of certainpre-established share priceawarded.
4246
targets) remain subject to satisfaction of such applicable performance conditions. The Separation Agreement addresses the timing of payments and distributions to Mr. MichenerStern so that they remain exempt from or comply with the provisions of SectionsSection 409A and 457A of the Internal Revenue Code. The Separation Agreement also contains covenants by Mr. MichenerStern relating to protection of the Company’s confidential information, cooperation,non-competition,non-solicitation andnon-disparagement and other standard provisions, as well as a release of claims by Mr. Michener.Stern. Payments pursuant to the Separation Agreement are subject to forfeiture and/or clawback in the event of violation of such covenants.
2019 EXECUTIVE COMPENSATION CONCLUSION
We made changesOur performance exceeded every financial performance target set by the Compensation Committee at the beginning of the year. Nevertheless, in two instances where the results were above target but below the results from the previous year, the Compensation Committee chose to exercise its negative discretion and reduce the scores awarded on those measures to below what they would have been otherwise. As a result, the overall achievement score awarded by the Compensation Committee on the financial performance measures, 83.1%, was lower than the score awarded last year, 89.8%. This held down the overall achievement scores of all of our executive compensation programofficers as compared to last year, and resulted in early 2015 in responseMr. Frederico receiving an overall achievement score, and a cash incentive award, slightly below what he received last year.
Our Compensation Committee wished to shareholder engagement. For example,recognize the Compensation Committee’s discretionconsiderable accomplishments of all of our executive officers with respect to the cash incentive was reducedfinancial performance goals, especially the amount of PVP achieved in markets with historically low interest rates and credit spreads, as well as their accomplishments of theirnon-financial objectives, especially the link between pay and performance was enhanced. We received advisory shareholder approvalestablishment of over 98% of the compensation we paidAssured Investment Management. The Compensation Committee also wished to incentivize our executive officers to continue to contribute to our named executive officersCompany as we transform into a financial services company active in both financial guaranty insurance and asset management, under the three years since that time,leadership and have not made any major changes to our executivein accordance with the vision of Mr. Frederico. In the case of Mr. Frederico, the Compensation Committee accomplished this by increasing his long-term equity compensation program since then.by $750,000 in targeted nominal value.
The Compensation Committee believes that our executive compensation program rewards performance and motivates theour executive officers to increase shareholder value, and that it is therefore appropriate and in the best interests of our Company and our shareholders. Our strategy requires exceptionally qualified and experienced management in senior financial guaranty executive, finance and legal positions, including personnel with skills and experience in reinsurance, acquisitions and corporate integration as well as asset management, and the ability to deal with adverse market conditions and take advantage of market opportunities. During this critical period in our Company’s history, the Compensation Committee believes that retaining and motivating our executive officers and staff is essential, and that the various elements of total compensation have worked well to attract, retain and properly reward management for their performance.
PAYOUT UNDER PERFORMANCE RETENTION PLAN
The Performance Retention Plan, which we refer to as the PRP, had been utilized as a form of incentive compensation for the executive officers until 2015. Its focus on adjusted book value and operating return on equity over a multi-year performance period reduced the incentive to concentrate on short-term gain and fostered a long-term view that minimized unnecessary or excessive risk taking.
In response to shareholder feedback that we should simplify our executive compensation program and emphasize equity rather than cash for incentive compensation, the Compensation Committee stopped granting our then executive officers new PRP awards beginning in 2015.
However, the We continue to grant PRP awards to employees other than our executive officers didofficers. Ms. Chow, who was not an executive officer until 2018, continued to receive PRP awards inthrough February 2014, the final installment of which vested on December 31, 2017, so each of the executive officersshe also received a cash distribution in March 20182020 resulting from those awards.her PRP awards in February 2016 and 2017.
The principal amount of each PRP award is divided into three installments. The portion of principal associated with each installment and the performance period relating to such installment are set out in the terms of the award.
The award payment for each installment is the product of:
Principal amount of award
Portion of principal associated with installment
50% of the sum of 1 and the percentage change in the core ABV per share for the relevant performance period
50% of the sum of 1 and the core operating ROE for the relevant performance period
For the executive officers, no amount is payable if our core ABV per share has declined for the applicable performance period and if our core operating ROE is not at least 3% on average for each year in the applicable performance period. However, if, in a subsequent performance period, there is either positive growth in our core ABV per share or our core operating ROE is at least 3% on average for each year in the applicable performance period, each executive officer who remains employed at our Company will receive the recalculated payment.
The following table sets forth the calculation of the returns on the installment of the PRP award granted in February 2014 that vested on December 31, 2017:
Grant Date
| Performance
| Performance
| Portion of
| Percentage
| Core
| 50% of
| ||||||||||||||||||
February 2014
|
|
January 1, 2014
|
|
|
December 31, 2017
|
|
|
50%
|
|
|
57%
|
|
|
43%
|
|
|
50%
|
| ||||||
43
The individual PRP payouts for amounts that vested on December 31, 20172019 are set forth in footnote 2 to the Summary Compensation Table. Those PRP payouts were a function of decisions made by the Compensation Committee in February 20142016 and 2017 regarding the amount of PRP to award relating to theMs. Chow’s achievements before she became an executive officers’ achievementsofficer and during the 20132015 and 2016 performance years, as well as growth in core ABV per share and the core operating ROE during the relevant performance periods.
The strong growth in core ABV per share and the core operating ROE during the performance periods shown in the table above was driven in large part by achievements of our named executive officers during those performance periods. For example, the efficient management of capital, the various acquisitions, recoveries from our loss mitigation activities, gains on reassumptions of previously ceded business and the generation of PVP through the writing of new business each contributed to both the increase in core ABV per share and core operating ROE, while the core operating ROE was also impacted by terminations of insured transactions.
47
The Role of the Board’s Compensation Committee
The Compensation Committee oversees all aspects of our executive compensation program. The Compensation Committee has responsibility for:
Establishing executive compensation policies
Determining the compensation of our CEO
Reviewing our CEO’s compensation recommendations regarding other senior officers and determining appropriate compensation for such officers
Our Board has adopted a Compensation Committee Charter to govern the Compensation Committee’s activities. The charter, which may be found on our website atwww.assuredguaranty.com/governance, is reviewed annually by the Compensation Committee. Under its charter, the Compensation Committee is authorized to retain compensation, legal, accounting and other expert consultants at our expense.
The Role of the Independent ConsultantConsultants
For more than ten years, including in 2017,2019, the Compensation Committee has engaged Cook as its independent compensation consultant and considered advice and information from that firm in determining the amount and form of compensation for the executive officers. As part of its engagement, Cook advised the Compensation Committee in 2014 and 2015 about the changes to the cash incentive portion of our executive compensation program. Every two years,Periodically, the Nominating and Governance Committee also engages Cook to conduct a comprehensive review of the compensation package for the independent directors; Cook last undertook such a comprehensive review in 2017. The Compensation Committee also consulted with Cook and considered its advice with respect to the terms of the Separation Agreement with Mr. Michener. Cook has not provided any additional consulting service to us beyond its role as consultant to the Compensation Committee and the Nominating and Governance Committee.2019.
In 2017,2019, Cook’s work for the Compensation Committee included analyzing our compensation practices in light of best practices, providing a compensation risk assessment, reviewing and advising us on changes to our comparison group of companies, collecting and providing relevant market data, reviewing data and analyses provided by other consultants, and updating the Compensation Committee with respect to evolving governance trends.
The Compensation Committee has considered the independence of Cook in light of SEC rules and NYSE listing standards. It has requested and received a letter from Cook in 20172019 affirming factors relevant to assessing Cook’s independence. The Compensation Committee discussed the content of the letter and concluded that Cook’s work did not raise any independence or conflict of interest issues.
When the Compensation Committee began to contemplate amending the long term equity incentive program to include performance share units based on relative TSR performance in 2018, we engaged Aon to model the the grant date fair value and ultimate performance and payout of hypothetical Relative TSR PSUs with various characteristics and, once the characteristics of the Relative TSR PSUs were settled, to provide grant date valuation of the Relative TSR PSUs and to provide Relative TSR PSU value tracking over the life of the Relative TSR PSUs. Aon’s compensation consulting work for us began in 2018 and concluded with our establishment of the TSR PSUs in February 2019. While we have engaged Aon to calculate and report on the value of the TSR PSUs on an ongoing basis, we have not engaged Aon as a compensation consultant since we established the TSR PSUs in February 2019.
Executive Compensation Comparison Group
The Compensation Committee examines pay data for the following 1220 companies to review pay practices, identify compensation trends, and benchmark its executive compensation decisions:
|
Enstar Group Limited | Radian Group | ||
Alleghany Corporation | Essent Group, Ltd. | RenaissanceRe Holdings | ||
Arch Capital Group | Everest Re Group, Ltd. | Sculptor Capital
| ||
Argo Group International Holdings, Ltd. |
| |||
First American Financial Corporation | Selective Insurance Group, Inc
| |||
Assurant, Inc. |
| |||
Janus Henderson Group | The Hanover Insurance Group, Inc.
| |||
AXIS Capital Holdings Limited | Legg Mason | White Mountains Insurance Group, Inc. | ||
Eaton Vance Corp. | MGIC Investment Corporation | |||
Companies new to the comparison group this year are indicated inbold.
48
The Compensation Committee has long recognized that the comparison group has limitations. Our company is the only publicly-traded financial services company primarily writing new financial guaranty business in today’s markets, and we have now established Assured Investment Management, an asset management division that is one of the top 20 CLO managers by assets under management*.
Notably, the comparison group consists primarily of mortgage finance and property and casualty insurance and reinsurance companies.companies, along with the four asset managers added this year. Despite the specialized nature of our primary financial guaranty business, our Compensation Committee looks for companies domiciled in Bermuda or with a similar size, global business model and compensation mix to
44
ours. ours, along with publicly traded asset management companies to reflect the establishment of Assured Investment Management. Although the factors the Compensation Committee considers for its compensation decisions and the level of compensation may differ from those for the comparison group, the Compensation Committee finds it useful to consider the pay practices at these companies.
In November 2017,2019 and early February 2020, Cook met with members of the Compensation Committee to review the comparison group from the prior year, and to discuss whether other companies should be considered for inclusion in the group, which in the prior year comprised 16 companies. Cook noted that we had acquired BlueMountain and established Assured Investment Management since the last time the comparison group had been reviewed in 2018. Based on Cook’s review in November 2019 and February 2020 and the importance of the asset management business to our strategic vision, Cook recommended that we add several asset managers to our comparison group. The
Cook informed the Compensation Committee had added Ambac Financial Groupthat it recommended adding four asset management companies to the comparison group. Cook looked for asset management companies that were similar to our asset management business, screening for size, business model and presence in a peer network, and recommended adding to our comparison group the prior year, to replace Partner Re, which had been acquired earlierfour asset management companies indicated inbold in the year. above list.
Cook advised the Compensation Committee that, as of December 31, 2019, ourone-year and three-year TSRs ranked near the currentmedian of the revised comparison group. Cook also informed the Compensation Committee that, as of September 30, 2019, our latest four quarters of operating income and net income are both near the median of our revised comparison group and our market capitalization falls between the 25th percentile and median of the revised comparison group; our total assets were between the median and the 75th percentile; and both our latest four quarters of revenue and number of employees was in the bottom quartile of the group.
The revised comparison group consists of companies that, like our Company, have a business model that involves underwriting or credit risk, a holding company structure, and similar size as measured by revenues, assets and market capitalization. Since November 2016, Endurance Specialty and Allied World Assurance were acquired and therefore have been removed from the comparison group. Cook performed an independent review to determine whether to change or add to the remaining 12 companies in the comparison group, and ultimately concluded the remaining companies continue to be reasonable for competitive comparison purposes.
Cook advised the Compensation Committee that, as of September 30, 2017, ourone-year TSR ranked in the 91st percentile of the current comparison group and ourthree-year TSR was the highest in the comparison group. Cook also informed the Compensation Committee that, as of September 30, 2017, our latest four quarters of revenue approximate the median of the current comparison group; our latest quarter of assets and market capitalization fall between the median and the 75th percentile; our net income is near the comparison group’s “high” number; and the number of employees at our Company is below the 25th percentile.
Based on Cook’s recommendation, the Compensation Committee agreed that the 1220 companies listed above would continue to constitute the Company’s comparison group for 2018.2019.
Executive Officer Recoupment Policy
Our Board of Directors adopted a recoupment (or clawback) policy in February 2009 pursuant to which the Compensation Committee may rescind or recoup certain of the compensation of an executive officer if such person engages in misconduct related to a restatement of our financial results or of objectively quantifiable performance goals, and the achievement of those goals is later determined to have been overstated.
In connection withRule 10D-1 proposed by the SEC, the Compensation Committee amended the recoupment policy in November 2015 so that it would apply, to the extent required by law, to incentive compensation received in the three year period before a determination that a material restatement is required. The amended recoupment policy allows the Company to recoup incentive compensation which is granted before the adoption and effectiveness of a finalRule 10D-1, but which may be subject to the three year look-back period of any such final rule.
To demonstrate our commitment to building shareholder value, the Board of Directors adopted management stock ownership guidelines. Our guidelines do not mandate a time frame by which this ownership must be attained, but each executive officer must retain 100% of his or herafter-tax receipt of Company stock until he or she reaches histheir ownership goal. Please see “Information About Our Common Share Ownership—How Much Stock is Owned by Directors and Executive Officers” for detailed information on the executive officers’ stock ownership.
| * | As reported by Creditflux for the fourth quarter of 2019. |
49
The chart below shows the guideline for each of our named executive officers and each executive’s stock ownership as of March 8, 2018,13, 2020, the record date, using $34.49,$34.56, the closing price of one of our Common Shares on the NYSE on such date.
Named Executive Officer | Guideline | Current Ownership | ||||||
Dominic J. Frederico | 7 × Salary |
|
|
43.2 × Salary | * | |||
Robert A. Bailenson |
|
5 × Salary | ||||||
|
| 10.4 × Salary |
| |||||
Ling Chow** |
|
|
|
|
|
| ||
Russell B. Brewer II | | 5 × Salary |
|
| 11.9 × Salary |
| ||
Bruce E. Stern | 5 × Salary |
|
|
| ||||
|
|
|
|
| ||||
|
|
| ||||||
|
|
|
| |||||
| * | Common shares beneficially owned by Mr. Frederico include 900,000 shares he pledged in March 2020, in accordance with our stock trading policy, to secure a personal loan to purchase a home. Mr. Frederico intends to repay the loan and release the pledged shares in the short term. |
| ** | Ms. Chow became an executive officer |
45
These ownership levels include shares owned and, in the case of Mr. Bailenson, vested share units credited to hisnon-qualified retirement plan. Unvested RSUs, unvested performance share units and unexercised options do not count towards the guidelines. Some of the executive officers who have reached their share ownership goals have made gifts of shares to family or to charitable or educational institutions.
We adopted an anti-hedging policy in 2013 that explicitly prohibits employees and directors from hedging our Common Shares.
Our stock trading policy prohibits employees and directors from pledging our Common Shares without the approval of both our General Counsel and the Nominating and Governance Committee. There have been noOur stock trading policy requires that, in order to grant such transactionsapproval, our Nominating and Governance Committee determine that the person making the pledge demonstrates the financial capacity to date.repay the loan (which does not constitute margin debt) without resorting to the pledged securities. In March 2020, in accordance with such policy, Mr. Frederico pledged 900,000 of our Common Shares to secure a personal loan to purchase a home. Mr. Frederico intends to repay the loan and release the pledged shares in the short term. Even if such shares are excluded from his total, on March 13, 2020, Mr. Frederico owned Common Shares in an amount equal to 18.3x his salary, significantly in excess of his guideline of 7x his salary. No other director or executive officer has pledged Common Shares.
The Compensation Committee meets during our February board meeting to make executive compensation decisions with respect to the previous year’s performance and to make its compensation recommendations to the other directors. After consulting with the Board, the Compensation Committee approves executive officer salary increases (if any), cash incentive compensation, and long-term equity incentive awards. Payments under existing PRP awards (if any) and cash incentives are not paid until after we file with the SEC our Annual Report onForm 10-K for the previous calendar year with the SEC.year.
We maintaintax-qualified andnon-qualified defined contribution retirement plans for our executive officers and other eligible employees. We do not maintain any defined benefit pension plans. The Compensation Committee and our management believe that it is important to provide retirement benefits to employees who reach retirement in order to attract and retain key employees. All retirement benefits are more fully described on pages 59 to 61 under “Potential Payments Upon Termination or Change in Control.”
Benefit Under Defined Contribution Plans
| Description
| |
Core contribution |
We contribute 6% of each employee’s salary and cash bonus compensation, which we refer to as eligible | |
Company match |
We match 100% of each employee’s contribution, up to 6% of eligible | |
50
Under our severance policy for executive officers, following the executive’s involuntary termination without cause or voluntary termination for good reason and subject to the executive signing a release of claims, the executive will receive alump-sum payment in an amount equal to one year’s salary plus his average cash incentive amount over the precedingthree-year period, plus apro-rata annual cash incentive amount for the year of termination and an amount equal to one year of medical and dental premiums. The executive officer’s receipt of severance benefits is subject to his compliance withnon-competition,non-solicitation, and confidentiality restrictions during his employment and for a period of one year following termination of employment. We, in our discretion, may choose to pay one year of base salary to an executive who terminates employment for a reason other than involuntary termination without cause or voluntary termination for good reason, in which case the executive will also be subject tonon-competition,non-solicitation, and confidentiality restrictions following his termination of employment. In accordance with his Separation Agreement, Mr. Michener will
remain eligible for our severance policy for any termination prior to the Retirement Date specified in such agreement.
We provide change in control benefits to encourage executives to consider the best interests of shareholders by mitigating any concerns about their own personal financial well-being in the face of a change in control of our Company. Based on shareholder input and changing market trends, since 2011, in the event of a change in control:
Long-term incentive awards will vest only upon certain terminations of employment following a change in control (double-trigger)
Such awards will vest upon a change in control (single-trigger) if the acquirer does not assume the awards
We do not provide excise tax reimbursements andgross-up payments in the case of a change in control
Detailed information is provided on page 60 under “Potential Payments Upon Termination or Change in Control.”
46
Section 162(m) of the Internal Revenue Code limits the deductibility of annual compensation in excess of $1 million paid to “covered employees” of the Company, unless the compensation satisfied an exception, such as the exception for performance-based compensation. Performance-based compensation generally includes only payments that are contingent on achievement of performance objectives, and excludes fixed or guaranteed payments. On December 22, 2017, the 2017 Tax Act was enacted, which, among other things, repealed the performance-based compensation exception and expanded the definition of covered employee. The changes to Section 162(m) are effective for taxable years beginning after December 31, 2017. The 2017 Tax Act includes a transition rule so that these changes do not apply to compensation paid pursuant to a “binding written contract” that was in effect on November 2, 2017 and that was not materially modified on or after such date.
Because of the performance-based compensation exception repeal, amounts paid pursuant to a contract effective after November 2, 2017 will not be deductible as performance-based compensation, and the Compensation Committee will not need to consider the requirements of the performance-based compensation exception when considering the design of any such future contracts as part of our compensation program. For amounts paid under contracts in effect on November 2, 2017 that were intended to constitute performance-based compensation, the Compensation Committee will continue to consider the performance-based compensation exception when making determinations of performance under those contracts.
The 2017 Tax Act also expands the definition of covered employee. For 2017, our covered employees included our CEO and other named executive officers (but not the chief financial officer) who were executive officers as of the last day of our fiscal year. For 2018 and thereafter, our covered employees will generally include anyone who (i) was our CEO or chief financial officer at any time during the year, (ii) was one of the other named executive officers who was an executive officer as of the last day of the fiscal year, and (iii) was a covered employee for any previous year after 2016.
As with prior years, although the Compensation Committee will consider deductibility under Section 162(m) with respect to the compensation arrangements for executive officers, deductibility will not be the sole factor used in determining appropriate levels or methods of compensation. The Compensation Committee considers many factors when designing its compensation arrangements in addition to the deductibility of the compensation, and maintains the flexibility to grant awards or pay compensation amounts that arenon-deductible if they believe it is in the best interest of our Company and our shareholders.
In addition, Section 409A of the Internal Revenue Code imposes restrictions on nonqualified deferred compensation plans. We maintain deferred compensation plans for the benefit of our employees, including nonqualified deferred compensation plans that provide for employee and employer contributions in excess of the IRS defined contribution plan limits. The deferred compensation plans we maintain are intended to be exempt from the requirements of Section 409A or, if not exempt, to satisfy the requirements of Section 409A, and we have reviewed and, where appropriate, have amended each of our deferred compensation plans to meet the requirements.
Finally, Section 457A of the Internal Revenue Code imposes restrictions on nonqualified deferred compensation plans maintained by a nonqualified entity (which generally includes an entity in a jurisdiction that is not subject to U.S. income tax or a comprehensive foreign income tax). The deferred compensation plans we maintain are intended to be exempt from the requirements of Section 457A for benefits accrued or awards granted on or after January 1, 2009 (the effective date of Section 457A). Also, we had amended certain deferred compensation plans in which benefits were accrued or awards granted prior to January 1, 2009 to provide that such benefits would be distributed in a singlelump-sum payment in January 2017 (to the extent not previously distributed) to satisfy the requirements of Section 457A, and such benefits were distributed on January 6, 2017.457A.
51
This proxy statement references financial measures that are not determined in accordance with U.S. GAAP, and are identified as core, operating, PVP ornon-GAAP. Although thesenon-GAAP financial measures should not be considered substitutes for U.S. GAAP measures, our management and Board consider them important performance indicators and have employed them as well as other factors in determining senior management incentive compensation.
We referenced in theManagement’s Discussion and Analysis in our Annual Report onForm10-K for the year ended December 31, 20172019 certain of thenon-GAAP financial measures we use in this proxy statement. The definitions for thosenon-GAAP financial measures, which are listed below, and how they may be calculated from the most directly comparable GAAP financial measures, may be found on pages 92106 to 96110 of our Annual Report onForm 10-K for the year ended December 31, 2017.2019, which is available on our website atwww.assuredguaranty.com.
| • |
|
| • |
|
| • |
|
| • | PVP or present value of new business production |
47
This proxy also references certainnon-GAAP financial measures, which are identified as “core”, that our management and Board also consider important performance indicators and have employed, as well as other factors, in determining senior management incentive compensation. These “core” measures, and how they are calculated from our GAAP financial statements, are as follows:
| • | Core operating income per diluted share. After making the adjustments to net income attributable to Assured Guaranty Ltd. described on pages |
| • | Core operating shareholders’ equity per share.After making the adjustments to shareholders’ equity attributable to Assured Guaranty Ltd. described on pages |
| • | Core ABV. After making the adjustments to shareholders’ equity attributable to Assured Guaranty Ltd. described on pages |
| • | Core operating ROE. Core operating ROE is calculated as core operating income divided by the average of core operating shareholders’ equity at the beginning and end of the period. |
48
The Compensation Committee has reviewed and discussed the Compensation Discussion and Analysis contained in this proxy statement with management and, based on such review and discussion, the Compensation Committee recommended to the Board of Directors that the Compensation Discussion and Analysis be included in our Company’s Annual Report onForm 10-K for the year ended December 31, 20172019 and this proxy statement. The foregoing report has been approved by the Compensation Committee.
Patrick W. Kenny, Chairman
G. Lawrence Buhl
SimonThomas W. LeathesJones
4952
20172019 SUMMARY COMPENSATION TABLE
The following table provides compensation information for 2017, 20162019, 2018 and 20152017 for our named executive officers.
Name and Principal
| Year
| Salary
| Stock Awards(1)
|
Non-Equity Incentive Plan Compen- sation(2)
| All Other Compen- sation(3)
| Total
| Year
| Salary
| Stock Awards(1)
|
Non-Equity Incentive Plan Compen- sation(2)
| All Other Compen- sation(3)
| Total
| ||||||||||||||||||||||||||||||||||||
Dominic J. Frederico, |
|
2017 |
|
|
$1,250,000 |
|
|
$6,588,270 |
|
|
$4,862,500 |
|
|
$826,014 |
|
|
$13,526,784 |
|
|
2019 |
|
|
$1,250,000 |
|
|
$6,424,343 |
|
|
$3,727,000 |
|
|
$752,127 |
|
|
$12,153,470 |
| ||||||||||||
President and Chief | 2016 | $1,150,000 | $5,090,589 | $5,717,851 | $768,875 | $12,727,315 | 2018 | $1,250,000 | $6,865,967 | $3,812,000 | $843,935 | $12,771,902 | ||||||||||||||||||||||||||||||||||||
Executive Officer
|
| 2015
|
|
| $1,150,000
|
|
| $4,708,445
|
|
| $5,609,813
|
|
| $711,731
|
|
| $12,179,989
|
|
| 2017
|
|
| $1,250,000
|
|
| $6,588,270
|
|
| $4,862,500
|
|
| $826,014
|
|
| $13,526,784
|
| ||||||||||||
Robert A. Bailenson, |
|
2017 |
|
|
$625,000 |
|
|
$1,557,236 |
|
|
$1,953,125 |
|
|
$286,085 |
|
|
$4,421,446 |
|
|
2019 |
|
|
$700,000 |
|
|
$1,606,106 |
|
|
$1,994,720 |
|
|
$364,809 |
|
|
$4,665,635 |
| ||||||||||||
Chief Financial | 2016 | $600,000 | $1,119,915 | $2,207,475 | $230,530 | $4,157,920 | 2018 | $700,000 | $1,791,111 | $1,949,920 | $314,899 | $4,755,930 | ||||||||||||||||||||||||||||||||||||
Officer
|
| 2015
|
|
| $550,000
|
|
| $1,046,351
|
|
| $1,920,375
|
|
| $191,279
|
|
| $3,708,005
|
|
| 2017
|
|
| $625,000
|
|
| $1,557,236
|
|
| $1,953,125
|
|
| $286,085
|
|
| $4,421,446
|
| ||||||||||||
James M. Michener, |
|
2017
|
|
|
$625,000 |
|
|
$1,197,815 |
|
|
$1,964,375 |
|
|
$505,545 |
|
|
$4,292,735 |
| ||||||||||||||||||||||||||||||
Ling Chow |
|
2019 |
|
|
$525,000 |
|
|
$1,070,695 |
|
|
$1,769,140 |
|
|
$236,317 |
|
|
$3,601,152 |
| ||||||||||||||||||||||||||||||
General Counsel | 2016 | $600,000 | $1,018,118 | $2,355,089 | $487,858 | $4,461,065 |
| 2018
|
|
| $500,000
|
|
| $1,275,345
|
|
| $1,631,350
|
|
| $195,344
|
|
| $3,602,039
|
| ||||||||||||||||||||||||
|
| 2015
|
|
| $550,000
|
|
| $941,700
|
|
| $2,338,881
|
|
| $443,359
|
|
| $4,273,940
|
| |||||||||||||||||||||||||||||||
Russell B. Brewer II, |
|
2017 |
| $500,000 |
|
$1,317,654 |
| $1,734,250 |
|
$253,803 |
|
|
$3,805,707 |
|
|
2019 |
|
|
$525,000 |
|
|
$1,177,776 |
|
|
$1,548,015 |
|
|
$284,043 |
|
|
$3,534,834 |
| ||||||||||||||||
Chief Surveillance | 2016 | $450,000 | $1,119,915 | $1,762,939 | $223,481 | $3,556,335 | 2018 | $525,000 | $1,313,465 | $1,583,715 | $286,076 | $3,708,256 | ||||||||||||||||||||||||||||||||||||
Officer
|
| 2015
|
|
| $400,000
|
|
| $941,700
|
|
| $1,784,931
|
|
| $191,288
|
|
| $3,317,919
|
|
| 2017
|
|
| $500,000
|
|
| $1,317,654
|
|
| $1,734,250
|
|
| $253,803
|
|
| $3,805,707
|
| ||||||||||||
Bruce E. Stern, |
|
2017 |
|
|
$470,000 |
|
|
$838,490 |
|
|
$1,255,420 |
|
|
$192,864 |
|
|
$2,756,774 |
|
|
2019 |
|
|
$500,000 |
|
|
$749,533 |
|
|
$1,227,800 |
|
|
$225,811 |
|
|
$2,703,144 |
| ||||||||||||
Executive Officer | 2016 | $450,000 | $712,678 | $1,274,087 | $184,236 | $2,621,001 | 2018 | $500,000 | $955,293 | $1,227,800 | $207,800 | $2,890,893 | ||||||||||||||||||||||||||||||||||||
|
| 2015
|
|
| $400,000
|
|
| $627,800
|
|
| $1,259,694
|
|
| $139,415
|
|
| $2,426,909
|
|
| 2017
|
|
| $470,000
|
|
| $838,490
|
|
| $1,255,420
|
|
| $192,864
|
|
| $2,756,774
|
| |||||||||||||
| (1) | This column represents the grant date value of performance share unit awards and restricted share unit awards granted in 2019, 2018 and 2017 |
| (2) | This column represents cash incentive compensation for |
D. Frederico
|
R. Bailenson
|
J. Michener
|
R. Brewer
|
B. Stern
| ||||||||||||||||
2017 Cash Incentive Compensation
|
|
$4,525,000
|
|
|
$1,728,125
|
|
|
$1,728,125
|
|
|
$1,498,000
|
|
|
$1,097,920
|
| |||||
2017 PRP Payout
|
|
$337,500
|
|
|
$225,000
|
|
|
$236,250
|
|
|
$236,250
|
|
|
$157,500
|
| |||||
Total
|
|
$4,862,500
|
|
|
$1,953,125
|
|
|
$1,964,375
|
|
|
$1,734,250
|
|
| $1,255,420
|
| |||||
| D. Frederico | R. Bailenson | L. Chow | R. Brewer | B. Stern | ||||||||||||||||
2019 Cash Incentive Compensation | $3,727,000 | $1,994,720 | $1,461,390 | $1,548,015 | $1,227,800 | |||||||||||||||
2019 PRP Payout | — | — | $307,750 | — | — | |||||||||||||||
Total | $3,727,000 | $1,994,720 | $1,769,140 | $1,548,015 | $1,227,800 | |||||||||||||||
| (3) | All Other Compensation for |
D. Frederico
|
R. Bailenson
|
J. Michener
|
R. Brewer
|
B. Stern
| D. Frederico | R. Bailenson | L. Chow | R. Brewer | B. Stern | |||||||||||||||||||||||||||||||
Employer Contribution to Retirement Plans
|
|
$689,753
|
|
|
$276,528
|
|
|
$276,528
|
|
|
$207,582
|
|
|
$173,060
|
|
| $607,440 |
|
| $317,990 |
|
| $214,296 |
|
| $253,046 |
|
| $207,336 |
| ||||||||||
Bermuda Housing Allowance
|
|
$23,688
|
|
|
—
|
|
|
$132,000
|
|
|
—
|
|
|
—
|
|
| $18,753 |
|
| — |
|
| — |
|
| — |
|
| — |
| ||||||||||
Bermuda Car Allowance
|
|
$20,000
|
|
|
—
|
|
|
$15,000
|
|
|
—
|
|
|
—
|
|
| $20,000 |
|
| — |
|
| — |
|
| — |
|
| — |
| ||||||||||
Bermuda Travel Allowance
|
|
$15,000
|
|
|
—
|
|
|
$15,000
|
|
|
—
|
|
|
—
|
|
| $15,000 |
|
| — |
|
| — |
|
| — |
|
| — |
| ||||||||||
Tax Preparation/Financial Planning
|
|
$32,732
|
|
|
$1,100
|
|
|
$28,458
|
|
|
$20,465
|
|
|
—
|
| |||||||||||||||||||||||||
Tax Return Preparation |
| $31,631 |
|
| $16,050 |
|
| $6,100 |
|
| $11,000 |
|
| $75 |
| |||||||||||||||||||||||||
Matching Gift Donations
|
|
$15,000
|
|
|
—
|
|
|
$15,000
|
|
|
$15,000
|
|
|
$8,300
|
|
| $15,000 |
|
| $15,000 |
|
| $15,000 |
|
| $15,000 |
|
| $11,100 |
| ||||||||||
Business-Related Spousal Travel
|
|
$8,054
|
|
|
$7,757
|
|
|
$13,359
|
|
|
$4,571
|
|
|
$1,263
|
|
| $21,568 |
|
| $15,769 |
|
| $921 |
|
| $4,997 |
|
| $4,319 |
| ||||||||||
Miscellaneous
|
|
$21,787
|
|
|
$700 |
|
|
$10,200
|
|
|
$6,185
|
|
|
$10,241
|
|
| $22,735 |
|
| — |
|
| — |
|
| — |
|
| $2,981 |
| ||||||||||
Total
|
|
$826,014
|
|
|
$286,085
|
|
|
$505,545
|
|
|
$253,803
|
|
|
$192,864
|
|
| $752,127 |
|
| $364,809 |
|
| $236,317 |
|
| $284,043 |
|
| $225,811 |
| ||||||||||
5053
None of our named executive officers currently have any employment agreements with the Company. See “Compensation Disclosure and Analysis—Separation Agreement” for a description of Mr. Michener’s Separation Agreement.
Our Company has established a perquisite policy pursuant to which we provide executive officers certain perquisites that are not available to employees generally. We believe that perquisites we provide to our named executive officers meet certain business objectives and that the benefit our Company receives from providing these perquisites significantly outweighs the cost of providing them. We feel these perquisites minimize distractions to our named executive officers, thereby enabling them to perform their responsibilities more efficiently. These include tax preparation, financial planning (until 2019, when it was eliminated), annual executive medical exams (for persons who became executive officers prior to December 31, 2017) and, for our executive officers located in Bermuda, housing and car allowances, Bermuda club memberships, and family travel stipend. We provide tax preparation and financial planning services to maximize the value of Company-provided compensation and to assist our named executive officers with tax compliance in various jurisdictions, especially since some of our named executive officers fulfill their responsibilities to the Company by working outside their home country for a portion of their time. In light of the challenges of the Bermuda market, including travel to and from the island, and the cost of living and maintaining a residence, the Bermuda perquisites are consistent with competitive practices in the Bermuda market and have been necessary for recruitment and retention purposes. Any of these perquisites may be modified by the Compensation Committee without the consent of the executive officers.
Prior to January 1, 2019, we provided tax preparation and financial planning services to maximize the value of Company-provided compensation and to assist our named executive officers with tax compliance in various jurisdictions, especially since some of our named executive officers fulfill their responsibilities to the Company by working outside their home country for a portion of their time. Beginning January 1, 2019, we no longer provide financial planning services.
In determining the total compensation payable to our named executive officers, the Compensation Committee considers perquisites in the context of the total compensation which our named executive officers are eligible to receive. However, given the fact that perquisites represent a relatively small portion of the executive’s total compensation, the availability of these perquisites does not materially influence the decisions made by the Compensation Committee with respect to other elements of the total compensation to which our named executive officers are entitled to or which they are awarded.
Our Company has adopted a severance policy for executive officers. For further detail, see the discussion in “Compensation Discussion and Analysis—Post-Employment Compensation—Severance” and “Potential Payments Upon Termination or Change ofControl—Change-in-Control Severance”. A severance policy enables us to attract and retain top candidates for our executive positions and enables us to have good relations with those executives.
We maintain a broad based employee stock purchase plan that gives our eligible employees the right to purchase our Common Shares through payroll deductions at a purchase price that reflects a 15% discount to the market price of our Common Shares on the first or last day of the relevant subscription period, whichever is lower. No participant may purchase more than $25,000 worth of Common Shares under this plan in any calendar year. In 2017,2019, Mr. Frederico, Mr. Stern and anothertwo other executive officerofficers participated in the employee stock purchase planplan; Mr. Frederico and Mr. Stern participated to the maximum extent possible.
We enter into indemnification agreements with our directors and executive officers. These agreements are in furtherance of ourBye-Laws which require us to indemnify our directors and officers for acts done, concurred in or omitted in or about the execution of their duties in their respective offices.
The indemnification agreements provide for indemnification arising out of specified indemnifiable events, such as events relating to the fact that the indemnitee is or was one of our directors or officers or is or was a director, officer, employee or agent of another entity at our request or relating to anything done or not done by the indemnitee in such a capacity.
The indemnification agreements provide for advancement of expenses.
These agreements provide for mandatory indemnification to the extent an indemnitee is successful on the merits. To the extent that indemnification is unavailable, the agreements provide for contribution.
The indemnification agreements set forth procedures relating to indemnification claims.
The agreements also provide for maintenance of directors’ and officers’ liability insurance.
5154
20172019 GRANTS OF PLAN-BASED AWARDS
The following table sets forth information concerning grants of plan-based awards for our named executive officers made during 2017.2019.
Estimated Future Payouts Under Non-Equity Incentive Plan Awards | Estimated Future Payouts Under Equity Incentive Plan Awards | Estimated Future Payouts Under Non-Equity Incentive Plan Awards | Estimated Future Payouts Under Equity Incentive Plan Awards | |||||||||||||||||||||||||||||||||||||||||||||||||||||||||||||
Name | Grant Date | Target | Maximum | Threshold | Target | Maximum | | All Other Stock Awards: Number of Shares of |
| | Grant Date Fair Value of Stock and Option Awards(4) | Grant Date | Target | Maximum | Threshold | Target | Maximum | | All Other Stock Awards: Number of Shares of |
| | Grant Date Fair Value of Stock and Option Awards(5) | ||||||||||||||||||||||||||||||||||||||||||
Dominic J. Frederico | Feb. 22, 2017(1) | $3,125,000 | $6,250,000 | — | — | — | — | — |
| Feb. 27, 2019(1) |
|
| $2,500,000 |
|
| $5,000,000 |
|
| — |
|
| — |
|
| — |
|
| — |
|
| — |
| ||||||||||||||||||||||||||||||||
| Feb. 22, 2017(2) | — | — | 34,635 | 69,270 | 138,540 | — | $3,722,570 |
| Feb. 27, 2019(2) |
|
| — |
|
| — |
|
| 22,444 |
|
| 44,888 |
|
| 112,220 |
|
| — |
|
| $2,094,474 |
| |||||||||||||||||||||||||||||||||
| Feb. 22, 2017(3) | — | — | — | — | — | 69,270 | $2,865,700 |
| Feb. 27, 2019(3) |
|
| — |
|
| — |
|
| 22,444 |
|
| 44,888 |
|
| 89,776 |
|
| — |
|
| $1,855,670 |
| |||||||||||||||||||||||||||||||||
| Feb. 27, 2019(4) |
|
| — |
|
| — |
|
| — |
|
| — |
|
| — |
|
| 59,850 |
|
| $2,474,199 |
| |||||||||||||||||||||||||||||||||||||||||
Robert A. Bailenson | Feb. 22, 2017(1) | $1,250,000 | $2,500,000 | — | — | — | — | — |
| Feb. 27, 2019(1) |
|
| $1,400,000 |
|
| $2,800,000 |
|
| — |
|
| — |
|
| — |
|
| — |
|
| — |
| ||||||||||||||||||||||||||||||||
| Feb. 22, 2017(2) | — | — | 8,187 | 16,373 | 32,746 | — | $879,885 |
| Feb. 27, 2019(2) |
|
| — |
|
| — |
|
| 5,611 |
|
| 11,222 |
|
| 28,055 |
|
| — |
|
| $523,619 |
| |||||||||||||||||||||||||||||||||
| Feb. 22, 2017(3) | — | — | — | — | — | 16,373 | $677,351 |
| Feb. 27, 2019(3) |
|
| — |
|
| — |
|
| 5,611 |
|
| 11,222 |
|
| 22,444 |
|
| — |
|
| $463,917 |
| |||||||||||||||||||||||||||||||||
James M. Michener | Feb. 22, 2017(1) | $1,250,000 | $2,500,000 | — | — | — | — | — | ||||||||||||||||||||||||||||||||||||||||||||||||||||||||
| Feb. 27, 2019(4) |
|
| — |
|
| — |
|
| — |
|
| — |
|
| — |
|
| 14,963 |
|
| $618,570 |
| |||||||||||||||||||||||||||||||||||||||||
Ling Chow |
| Feb. 27, 2019(1) |
|
| $1,050,000 |
|
| $2,100,000 |
|
| — |
|
| — |
|
| — |
|
| — |
|
| — |
| ||||||||||||||||||||||||||||||||||||||||
| Feb. 27, 2019(2) |
|
| — |
|
| — |
|
| 3,741 |
|
| 7,481 |
|
| 18,703 |
|
| — |
|
| $349,063 |
| |||||||||||||||||||||||||||||||||||||||||
| Feb. 22, 2017(2) | — | — | 6,297 | 12,594 | 25,188 | — | $676,802 |
| Feb. 27, 2019(3) |
|
| — |
|
| — |
|
| 3,741 |
|
| 7,481 |
|
| 14,962 |
|
| — |
|
| $309,265 |
| |||||||||||||||||||||||||||||||||
| Feb. 22, 2017(3) | — | — | — | — | — | 12,594 | $521,014 |
| Feb. 27, 2019(4) |
|
| — |
|
| — |
|
| — |
|
| — |
|
| — |
|
| 9,975 |
|
| $412,367 |
| |||||||||||||||||||||||||||||||||
Russell B. Brewer II | Feb. 22, 2017(1) | $1,000,000 | $2,000,000 | — | — | — | — | — |
| Feb. 27, 2019(1) |
|
| $1,050,000 |
|
| $2,100,000 |
|
| — |
|
| — |
|
| — |
|
| — |
|
| — |
| ||||||||||||||||||||||||||||||||
| Feb. 22, 2017(2) | — | — | 6,927 | 13,854 | 27,708 | — | $744,514 |
| Feb. 27, 2019(2) |
|
| — |
|
| — |
|
| 4,115 |
|
| 8,229 |
|
| 20,573 |
|
| — |
|
| $383,965 |
| |||||||||||||||||||||||||||||||||
| Feb. 22, 2017(3) | — | — | — | — | — | 13,854 | $573,140 |
| Feb. 27, 2019(3) |
|
| — |
|
| — |
|
| 4,115 |
|
| 8,229 |
|
| 16,458 |
|
| — |
|
| $340,187 |
| |||||||||||||||||||||||||||||||||
| Feb. 27, 2019(4) |
|
| — |
|
| — |
|
| — |
|
| — |
|
| — |
|
| 10,973 |
|
| $453,624 |
| |||||||||||||||||||||||||||||||||||||||||
Bruce E. Stern | Feb. 22, 2017(1) | $940,000 | $1,880,000 | — | — | — | — | — |
| Feb. 27, 2019(1) |
|
| $1,000,000 |
|
| $2,000,000 |
|
| — |
|
| — |
|
| — |
|
| — |
|
| — |
| ||||||||||||||||||||||||||||||||
| Feb. 22, 2017(2) | — | — | 4,408 | 8,816 | 17,632 | — | $473,772 |
| Feb. 27, 2019(2) |
|
| — |
|
| — |
|
| 2,619 |
|
| 5,237 |
|
| 13,093 |
|
| — |
|
| $244,358 |
| |||||||||||||||||||||||||||||||||
| Feb. 22, 2017(3) | — | — | — | — | — | 8,816 | $364,718 |
| Feb. 27, 2019(3) |
|
| — |
|
| — |
|
| 2,619 |
|
| 5,237 |
|
| 10,474 |
|
| — |
|
| $216,498 |
| |||||||||||||||||||||||||||||||||
| Feb. 27, 2019(4) |
|
| — |
|
| — |
|
| — |
|
| — |
|
| — |
|
| 6,983 |
|
| $288,677 |
| |||||||||||||||||||||||||||||||||||||||||
| (1) | Represents a grant of anon-equity incentive compensation award. As described in “Compensation Discussion and Analysis—Executive Compensation Program Structure and Process—Components of Our Executive Compensation Program—Cash Incentive Compensation”, the Compensation Committee uses atwo-step process for granting and paying annualnon-equity incentive compensation awards to executive officers. On the February |
| (2) | Represents a TSR performance share unit award. The TSR performance share units will vest at the end of a three-year vesting period based on the |
| (3) | Represents an ABV performance share unit award. The ABV performance share units will vest at the end of a three-year vesting period based on the Company’s growth in core adjusted book value, with limited exceptions. The number of ABV performance share units listed in |
55
| the Threshold column represents the number of ABV performance share units which shall become vested based on achievement of 50% of the performance target (growth in core adjusted book value of 12%); the number of ABV performance share units listed in the Target column represents the number of ABV performance share units which shall become vested based on achievement of 100% of the performance target (growth in core adjusted book value of 15%); and the number of ABV performance share units listed in the Maximum column represents the number of ABV performance share units which shall become vested based on achievement of 200% of the performance target (growth in core adjusted book value of 18%). If at least 50% of the ABV performance target is not achieved during the performance period, all of the ABV performance share units will be forfeited. |
Represents a time-based RSU award. Restrictions lapse on the third anniversary of the grant date of the award, subject to continued employment, with limited exceptions. |
This column discloses the aggregate grant date fair market value computed in accordance with U.S. GAAP, which is |
5256
The following table sets forth the outstanding equity awards held by our named executive officers as of December 31, 2017.2019.
| Option Awards | Stock Awards | Option Awards | Stock Awards | |||||||||||||||||||||||||||||||||||||||||||||||||||||||||||||||||||||
Name | Number of Securities Underlying Unexercised Options Exercisable | Option Exercise Price (per share) | Option Expiration Date | Number of Shares or Units of Stock That Have Not Vested | Market Value of Shares or Units of Stock That Have Not Vested | Equity Incentive Plan Awards: Number of Unearned Shares, Units or Other Rights That Have Not Vested | Equity Incentive Plan Awards: Market or Payout Value of Unearned Shares, Units or Other Rights That Have Not Vested | Number of Securities Underlying Unexercised Options Exercisable | Option Exercise Price (per share) | Option Expiration Date | Number of Shares or Units of Stock That Have Not Vested | Market Value of Shares or Units of Stock That Have Not Vested | Equity Incentive Plan Awards: Number of Unearned Shares, Units or Other Rights That Have Not Vested | Equity Incentive Plan Awards: Market or Payout Value of Unearned Shares, Units or Other Rights That Have Not Vested | ||||||||||||||||||||||||||||||||||||||||||||||||||||||||||
Dominic J. | 200,000 | $23.27 | 2/14/2018 | — | — | — | — |
| — |
|
| — |
|
| — |
|
| 69,270 |
|
| (1) |
|
| $3,395,615 |
|
| — |
|
| — |
| |||||||||||||||||||||||||||||||||||||||||
Frederico | 100,000 | $7.44 | 2/5/2019 | — | — | — | — |
| — |
|
| — |
|
| — |
|
| 122,262 |
|
| (2) |
|
| $5,993,283 |
|
| — |
|
| — |
| |||||||||||||||||||||||||||||||||||||||||
| 100,000 | $19.79 | 2/24/2020 | — | — | — | — |
| — |
|
| — |
|
| — |
|
| 82,237 |
|
| (3) |
|
| $4,031,258 |
|
| — |
|
| — |
| ||||||||||||||||||||||||||||||||||||||||||
| 112,055 | $17.44 | 2/9/2019 | — | — | — | — |
| — |
|
| — |
|
| — |
|
| — |
|
| — |
|
| 164,474 |
|
| (4) |
|
| $8,062,515 |
| ||||||||||||||||||||||||||||||||||||||||||
| — | — | — | 87,959 | (1) | $2,979,171 | — | — |
| — |
|
| — |
|
| — |
|
| 59,850 |
|
| (5) |
|
| $2,933,847 |
|
| — |
|
| — |
| |||||||||||||||||||||||||||||||||||||||||
| — | — | — | 175,918 | (2) | $5,958,343 | — | — |
| — |
|
| — |
|
| — |
|
| — |
|
| — |
|
| 22,444 |
|
| (6) |
|
| $1,100,205 |
| |||||||||||||||||||||||||||||||||||||||||
| — | — | — | 102,965 | (3) | $3,487,425 | — | — |
| — |
|
| — |
|
| — |
|
| — |
|
| — |
|
| 22,444 |
|
| (7) |
|
| $1,100,205 |
| |||||||||||||||||||||||||||||||||||||||||
| — | — | — | 205,930 | (4) | $6,974,849 | — | — | |||||||||||||||||||||||||||||||||||||||||||||||||||||||||||||||||
| — | — | — | 69,270 | (5) | $2,346,175 | — | — | |||||||||||||||||||||||||||||||||||||||||||||||||||||||||||||||||
| — | — | — | — | — | 34,635 | (6) | $1,173,087 | |||||||||||||||||||||||||||||||||||||||||||||||||||||||||||||||||
Robert A. | 10,000 | $7.44 | 2/5/2019 | — | — | — | — |
| — |
|
| — |
|
| — |
|
| 16,373 |
|
| (1) |
|
| $802,604 |
|
| — |
|
| — |
| |||||||||||||||||||||||||||||||||||||||||
Bailenson | 20,000 | $19.79 | 2/24/2020 | — | — | — | — |
| — |
|
| — |
|
| — |
|
| 28,898 |
|
| (2) |
|
| $1,416,580 |
|
| — |
|
| — |
| |||||||||||||||||||||||||||||||||||||||||
| 6,723 | $17.44 | 2/9/2019 | — | — | — | — |
| — |
|
| — |
|
| — |
|
| 21,453 |
|
| (3) |
|
| $1,051,626 |
|
| — |
|
| — |
| ||||||||||||||||||||||||||||||||||||||||||
| 6,835 | $19.24 | 2/7/2020 | — | — | — | — |
| — |
|
| — |
|
| — |
|
| — |
|
| — |
|
| 42,906 |
|
| (4) |
|
| $2,103,252 |
| ||||||||||||||||||||||||||||||||||||||||||
| — | — | — | 19,547 | (1) | $662,057 | — | — |
| — |
|
| — |
|
| — |
|
| 14,963 |
|
| (5) |
|
| $733,486 |
|
| — |
|
| — |
| |||||||||||||||||||||||||||||||||||||||||
| — | — | — | 39,094 | (2) | $1,324,114 | — | — |
| — |
|
| — |
|
| — |
|
| — |
|
| — |
|
| 5,611 |
|
| (6) |
|
| $275,051 |
| |||||||||||||||||||||||||||||||||||||||||
| — | — | — | 22,652 | (3) | $767,223 | — | — |
| — |
|
| — |
|
| — |
|
| — |
|
| — |
|
| 5,611 |
|
| (7) |
|
| $275,051 |
| |||||||||||||||||||||||||||||||||||||||||
Ling |
| 3,898 |
|
| $21.88 |
|
| 2/5/2021 |
|
| — |
|
| — |
|
| — |
|
| — |
| |||||||||||||||||||||||||||||||||||||||||||||||||||
Chow |
| — |
|
| — |
|
| — |
|
| 9,296 |
|
| (3) |
|
| $455,690 |
|
| — |
|
| — |
| ||||||||||||||||||||||||||||||||||||||||||||||||
| — | — | — | 45,304 | (4) | $1,534,446 | — | — |
| — |
|
| — |
|
| — |
|
| — |
|
| — |
|
| 18,592 |
|
| (4) |
|
| $911,380 |
| |||||||||||||||||||||||||||||||||||||||||
| — | — | — | 16,373 | (5) | $554,554 | — | — |
| — |
|
| — |
|
| — |
|
| 9,975 |
|
| (5) |
|
| $488,975 |
|
| — |
|
| — |
| |||||||||||||||||||||||||||||||||||||||||
| — | — | — | — | — | 8,187 | (6) | $277,294 |
| — |
|
| — |
|
| — |
|
| — |
|
| — |
|
| 3,741 |
|
| (6) |
|
| $183,384 |
| |||||||||||||||||||||||||||||||||||||||||
James M. | — | — | — | 17,592 | (1) | $595,841 | — | — | ||||||||||||||||||||||||||||||||||||||||||||||||||||||||||||||||
Michener | — | — | — | 35,184 | (2) | $1,191,682 | — | — | ||||||||||||||||||||||||||||||||||||||||||||||||||||||||||||||||
| — | — | — | 20,593 | (3) | $697,485 | — | — |
| — |
|
| — |
|
| — |
|
| — |
|
| — |
|
| 3,741 |
|
| (7) |
|
| $183,384 |
| |||||||||||||||||||||||||||||||||||||||||
| — | — | — | 41,186 | (4) | $1,394,970 | — | — |
| — |
|
| — |
|
| — |
|
| 2,560 |
|
| (8) |
|
| $125,491 |
|
| — |
|
| — |
| |||||||||||||||||||||||||||||||||||||||||
| — | — | — | 12,594 | (5) | $426,559 | — | — |
| — |
|
| — |
|
| — |
|
| 4,829 |
|
| (9) |
|
| $236,718 |
|
| — |
|
| — |
| |||||||||||||||||||||||||||||||||||||||||
| — | — | — | — | — | 6,297 | (6) | $213,279 |
| — |
|
| — |
|
| — |
|
| 9,890 |
|
| (10) |
|
| $484,808 |
|
| — |
|
| — |
| |||||||||||||||||||||||||||||||||||||||||
Russell B. | 10,000 | $19.79 | 2/24/2020 | — | — | — | — |
| — |
|
| — |
|
| — |
|
| 13,854 |
|
| (1) |
|
| $679,123 |
|
| — |
|
| — |
| |||||||||||||||||||||||||||||||||||||||||
Brewer II | 8,964 | $17.44 | 2/9/2019 | — | — | — | — |
| — |
|
| — |
|
| — |
|
| 24,452 |
|
| (2) |
|
| $1,198,637 |
|
| — |
|
| — |
| |||||||||||||||||||||||||||||||||||||||||
| 10,398 | $19.24 | 2/7/2020 | — | — | — | — |
| — |
|
| — |
|
| — |
|
| 15,732 |
|
| (3) |
|
| $771,183 |
|
| — |
|
| — |
| ||||||||||||||||||||||||||||||||||||||||||
| — | — | — | 17,592 | (1) | $595,841 | — | — |
| — |
|
| — |
|
| — |
|
| — |
|
| — |
|
| 31,464 |
|
| (4) |
|
| $1,542,365 |
| |||||||||||||||||||||||||||||||||||||||||
| — | — | — | 35,184 | (2) | $1,191,682 | — | — |
| — |
|
| — |
|
| — |
|
| 10,973 |
|
| (5) |
|
| $537,896 |
|
| — |
|
| — |
| |||||||||||||||||||||||||||||||||||||||||
| — | — | — | 22,652 | (3) | $767,223 | — | — |
| — |
|
| — |
|
| — |
|
| — |
|
| — |
|
| 4,115 |
|
| (6) |
|
| $201,717 |
| |||||||||||||||||||||||||||||||||||||||||
| — | — | — | 45,304 | (4) | $1,534,446 | — | — |
| — |
|
| — |
|
| — |
|
| — |
|
| — |
|
| 4,115 |
|
| (7) |
|
| $201,717 |
| |||||||||||||||||||||||||||||||||||||||||
Bruce E. |
| — |
|
| — |
|
| — |
|
| 8,816 |
|
| (1) |
|
| $432,160 |
|
| — |
|
| — |
| ||||||||||||||||||||||||||||||||||||||||||||||||
Stern |
| — |
|
| — |
|
| — |
|
| 15,560 |
|
| (2) |
|
| $762,751 |
|
| — |
|
| — |
| ||||||||||||||||||||||||||||||||||||||||||||||||
| — | — | — | 13,854 | (5) | $469,235 | — | — |
| — |
|
| — |
|
| — |
|
| 11,442 |
|
| (3) |
|
| $560,887 |
|
| — |
|
| — |
| |||||||||||||||||||||||||||||||||||||||||
| — | — | — | — | — | 6,927 | (6) | $234,617 |
| — |
|
| — |
|
| — |
|
| — |
|
| — |
|
| 22,884 |
|
| (4) |
|
| $1,121,774 |
| |||||||||||||||||||||||||||||||||||||||||
| — |
|
| — |
|
| — |
|
| 6,983 |
|
| (5) |
|
| $342,307 |
|
| — |
|
| — |
| |||||||||||||||||||||||||||||||||||||||||||||||||
| — |
|
| — |
|
| — |
|
| — |
|
| — |
|
| 2,619 |
|
| (6) |
|
| $128,383 |
| |||||||||||||||||||||||||||||||||||||||||||||||||
| — |
|
| — |
|
| — |
|
| — |
|
| — |
|
| 2,619 |
|
| (7) |
|
| $128,383 |
| |||||||||||||||||||||||||||||||||||||||||||||||||
5357
| Option Awards | Stock Awards | |||||||||||||||||||||||||||||||||||
Name | Number of Securities Underlying Unexercised Options Exercisable | Option Exercise Price (per share) | Option Expiration Date | Number of Shares or Units of Stock That Have Not Vested | Market Value of Shares or Units of Stock That Have Not Vested | Equity Incentive Plan Awards: Number of Unearned Shares, Units or Other Rights That Have Not Vested | Equity Incentive Plan Awards: Market or Payout Value of Unearned Shares, Units or Other Rights That Have Not Vested | |||||||||||||||||||||||||||||
Bruce E. | 10,000 | $19.79 | 2/24/2020 | — | — | — | — | |||||||||||||||||||||||||||||
Stern | 6,723 | $17.44 | 2/9/2019 | — | — | — | — | |||||||||||||||||||||||||||||
| 8,202 | $19.24 | 2/7/2020 | — | — | — | — | ||||||||||||||||||||||||||||||
| — | — | — | 11,728 | (1) | $397,227 | — | — | |||||||||||||||||||||||||||||
| — | — | — | 23,456 | (2) | $794,455 | — | — | |||||||||||||||||||||||||||||
| — | — | — | 14,415 | (3) | $488,236 | — | — | |||||||||||||||||||||||||||||
| — | — | — | 28,830 | (4) | $976,472 | — | — | |||||||||||||||||||||||||||||
| — | — | — | 8,816 | (5) | $298,598 | — | — | |||||||||||||||||||||||||||||
| — | — | — | — | — | 4,408 | (6) | $149,299 | |||||||||||||||||||||||||||||
| (1) | Represents a time-based RSU award. These units were granted on February 22, 2017, and vested on February |
| (2) | Represents a performance share unit award. These units were granted on February 22, 2017, and vested on February |
| (3) | Represents a time-based RSU award. These units were granted on February 21, 2018, and will vest on February |
| (4) | Represents a performance share unit award. These units were granted on February 21, 2018, and will vest on February |
| (5) | Represents a time-based RSU award. These units were granted on February 27, 2019, and will vest on February |
| (6) | Represents a TSR performance share unit award. These units were granted on February 27, 2019, and will vest on February |
| (7) | Represents an ABV performance share unit award. These units were granted on February 27, 2019, and will vest on February 27, 2022 subject to continued employment, with limited exceptions and achievement of |
| (8) | These units were granted on February 24, 2016, and vested on February 24, 2020. |
| (9) | These units were granted on February 22, 2017. One half of these units vested on February 22, 2020. The remaining half of these units will vest on February 22, 2021, subject to continued employment, with limited exceptions. |
| (10) | These units were granted on February 21, 2018. One third of these units vested on February 21, 2020. One third of these units will vest on February 21, 2021, subject to continued employment, with limited exceptions. The remaining one third of these units will vest on February 21, 2022, subject to continued employment, with limited exceptions. |
20172019 OPTION EXERCISES AND STOCK VESTED
The following table provides information concerning option exercises by, and vesting of restricted stock awards of, our named executive officers during 2017.2019.
| Option Awards | Stock Awards | Option Awards | Stock Awards | |||||||||||||||||||||||||||||
| Name | Number of Shares Acquired on Exercise(1) | Value Realized on Exercise(2) | Number of Shares Acquired on Vesting(3) | Value Realized on Vesting(4) | Number of Shares Acquired on | Value Realized on Exercise(2) | Number of Shares Acquired on | Value Realized on Vesting(4) | ||||||||||||||||||||||||
Dominic J. Frederico | — | — | 225,717 | $9,030,937 |
| 100,000 |
|
| $2,973,000 |
|
| 308,895 |
|
| $12,834,587 |
| ||||||||||||||||
Robert A. Bailenson | 10,000 | $184,800 | 42,133 | $1,685,741 |
| 26,835 |
|
| $734,287 |
|
| 67,956 |
|
| $2,823,572 |
| ||||||||||||||||
James M. Michener | 89,362 | $1,832,050 | 44,239 | $1,770,002 | ||||||||||||||||||||||||||||
Ling Chow |
| 8,700 |
|
| $225,434 |
|
| 10,250 |
|
| $423,722 |
| ||||||||||||||||||||
Russell B. Brewer II | — | — | 44,239 | $1,770,002 |
| — |
|
| — |
|
| 67,956 |
|
| $2,823,572 |
| ||||||||||||||||
Bruce E. Stern | — | — | 29,192 | $1,167,972 |
| 18,202 |
|
| $519,124 |
|
| 43,245 |
|
| $1,796,830 |
| ||||||||||||||||
54
| (1) | This column represents gross shares exercised, not reduced by shares withheld to pay for personal income tax and not reduced by shares swapped to pay for the option price. |
| (2) | The value realized on exercise represents the value of gross shares received, not reduced by shares withheld to pay for personal income tax, but reduced by shares swapped to pay for the option price. |
| (3) | This column represents gross shares vesting, not reduced by shares withheld to pay for personal income tax. |
| (4) | The value of a restricted share upon vesting is the fair market value of the stock on the vesting date. This column represents the value of gross shares vesting, not reduced by shares withheld to pay for personal income tax. |
58
NON-QUALIFIED DEFERRED COMPENSATION
The following table sets forth information concerning nonqualified deferred compensation of our named executive officers. The amounts set forth in this table include only contributions made and earnings received during 20172019 and do not include contributioncontributions and earnings with respect to the 20172019non-equity incentive compensation paid in 2018.2020.
| Name | Executive Contributions in Last FY(1) | Registrant Contributions in Last FY(2) | Aggregate Withdrawals/ Distributions(3) | Aggregate Earnings in Last FY | Aggregate Balance at Last FYE(4) | Executive Contributions in Last FY(1) | Registrant Contributions in Last FY(2) | Aggregate Withdrawals/ Distributions | Aggregate Earnings in Last FY | Aggregate Balance at Last FYE(3) | ||||||||||||||||||||||||||||||
Dominic J. Frederico | $328,676 | $657,353 | $12,577,909 | $575,820 | $8,050,735 | (5) |
| $286,920 |
|
| $573,840 |
|
| — |
|
| $2,550,942 |
|
| $11,610,559 | (4) | |||||||||||||||||||
Robert A. Bailenson | $122,064 | $244,128 | — | $231,945 | $3,804,903 |
| $142,195 |
|
| $284,390 |
|
| — |
|
| $1,210,151 |
|
| $5,888,060 |
| ||||||||||||||||||||
James M. Michener | $122,064 | $244,128 | $1,375,257 | $154,725 | $3,145,630 | |||||||||||||||||||||||||||||||||||
Ling Chow |
| $90,348 |
|
| $180,696 |
|
| — |
|
| $399,514 |
|
| $2,425,219 |
| |||||||||||||||||||||||||
Russell B. Brewer II | $87,591 | $175,182 | — | $464,927 | $3,993,480 |
| $109,723 |
|
| $219,446 |
|
| — |
|
| $258,521 |
|
| $5,018,417 |
| ||||||||||||||||||||
Bruce E. Stern | $70,330 | $140,660 | — | $42,048 | $2,307,554 |
| $86,868 |
|
| $173,736 |
|
| — |
|
| $114,976 |
|
| $2,952,245 |
| ||||||||||||||||||||
| (1) | The amounts in this column are also included in the Summary Compensation Table, in the Salary column and in theNon-Equity Incentive Plan Compensation column. |
| (2) | The amounts in this column are included in the Summary Compensation Table, in the All Other Compensation column as the employer contribution to the retirement plans. |
| (3) |
| Of the totals in this column plus, for Mr. Frederico |
| Name | 2017 Amount | 2016 Amount | 2019 Amount | 2018 Amount | ||||||||||||
Dominic J. Frederico | $8,472,020 | $7,592,360 | ||||||||||||||
Dominic��J. Frederico |
| $10,448,049 |
|
| $9,458,049 |
| ||||||||||
Robert A. Bailenson | $1,639,319 | $1,355,675 |
| $2,393,074 |
|
| $2,005,511 |
| ||||||||
James M. Michener | $2,551,073 | $2,228,225 | ||||||||||||||
Ling Chow |
| $220,500 |
|
| — |
| ||||||||||
Russell B. Brewer II | $876,354 | $644,910 |
| $1,453,767 |
|
| $1,139,127 |
| ||||||||
Bruce E. Stern | $344,439 | $150,300 |
| $793,554 |
|
| $555,429 |
| ||||||||
$1,612,387 was assumed from the ACE Limited Supplemental Retirement Plan at our 2004 initial public offering. |
POTENTIAL PAYMENTS UPON TERMINATION OR CHANGE IN CONTROL
The following tables quantify the potential payments upon termination that our named executive officers would receive assuming that the relevant termination event had occurred on December 31, 2017.2019. The last table quantifies the potential payments upon an involuntary termination without cause and a change of control that our named executive officers would receive assuming that both the termination without cause and change in control had occurred on December 31, 2017.2019.
TERMINATION DUE TO DEATH OR DISABILITY
| Name | Unvested RSUs | Unvested PSUs(1) | Total | Unvested PRP | Unvested RSUs | Unvested PSUs(1) | Total | |||||||||||||||||||||
Dominic J. Frederico | $8,812,771 | $10,738,572 | $19,551,343 |
| — |
|
| $10,360,720 |
|
| $11,639,440 |
|
| $22,000,160 |
| |||||||||||||
Robert A. Bailenson | $1,983,834 | $2,386,268 | $4,370,102 |
| — |
|
| $2,587,717 |
|
| $2,879,933 |
|
| $5,467,650 |
| |||||||||||||
James M. Michener(2) | $1,719,885 | $2,135,568 | $3,855,453 | |||||||||||||||||||||||||
Ling Chow |
| $125,000 |
|
| $1,791,681 |
|
| $753,322 |
|
| $2,670,003 |
| ||||||||||||||||
Russell B. Brewer II | $1,832,299 | $2,233,755 | $4,066,054 |
| — |
|
| $1,988,202 |
|
| $2,264,003 |
|
| $4,252,205 |
| |||||||||||||
Bruce E. Stern | $1,184,061 | $1,456,441 | $2,640,502 |
| — |
|
| $1,335,354 |
|
| $1,517,303 |
|
| $2,852,657 |
| |||||||||||||
55
| (1) | The value of the PSUs for this table was determined as if the applicable performance period ended on December 31, |
59
TERMINATION DUE TO RETIREMENT
| Name | Unvested RSUs | Unvested PSUs(1) | Total | Unvested PRP | Unvested RSUs | Unvested PSUs(1) | Total | |||||||||||||||||||||
Dominic J. Frederico | $5,703,535 | $10,738,572 | $16,442,107 |
| — |
|
| $6,546,849 |
|
| $11,639,440 |
|
| $18,186,289 |
| |||||||||||||
Robert A. Bailenson(2) | — | — | — |
| — |
|
| — |
|
| — |
|
| — |
| |||||||||||||
James M. Michener(3) | — | — | — | |||||||||||||||||||||||||
Ling Chow(3) |
| — |
|
| — |
|
| — |
|
| — |
| ||||||||||||||||
Russell B. Brewer II | $1,183,727 | $2,233,755 | $3,417,482 |
| — |
|
| $1,273,986 |
|
| $2,264,003 |
|
| $3,537,989 |
| |||||||||||||
Bruce E. Stern | $770,760 | $1,456,441 | $2,227,201 |
| — |
|
| $854,098 |
|
| $1,517,303 |
|
| $2,371,401 |
| |||||||||||||
| (1) | The value of the PSUs for this table was determined as if the applicable performance period ended on December 31, |
| (2) | Mr. Bailenson had not reached retirement age by December 31, |
| (3) | Ms. Chow had not |
TERMINATION WITHOUT CAUSE PAYMENTS (1)
| Name | Salary Continuation | Cash Incentive Compensation | Benefits | Unvested RSUs | Unvested PSUs(1) | Total | Salary Continuation | Cash Incentive Compensation | Benefits | Unvested RSUs | Unvested PSUs(2) | Total | ||||||||||||||||||||||||||||||||||||
Dominic J. Frederico | $1,250,000 | $4,042,979 | $42,846 | $8,812,771 | $10,738,572 | $24,887,168 |
| $1,250,000 |
|
| $4,278,313 |
|
| $48,044 |
|
| $10,360,720 |
|
| $11,639,440 |
|
| $27,576,517 |
| ||||||||||||||||||||||||
Robert A. Bailenson | $625,000 | $1,290,557 | $31,644 | $1,983,834 | $2,386,268 | $6,317,303 |
| $700,000 |
|
| $1,785,815 |
|
| $32,190 |
|
| $2,587,717 |
|
| $2,879,933 |
|
| $7,985,655 |
| ||||||||||||||||||||||||
James M. Michener(2) | $625,000 | $1,479,333 | $42,846 | $1,719,885 | $2,135,568 | $6,002,632 | ||||||||||||||||||||||||||||||||||||||||||
Ling Chow |
| $525,000 |
|
| $986,933 |
|
| $32,190 |
|
| $944,664 |
|
| $753,322 |
|
| $3,242,109 |
| ||||||||||||||||||||||||||||||
Russell B. Brewer II | $500,000 | $1,077,827 | $31,644 | $1,832,299 | $2,233,755 | $5,675,525 |
| $525,000 |
|
| $1,437,188 |
|
| $19,956 |
|
| $1,988,202 |
|
| $2,264,003 |
|
| $6,234,349 |
| ||||||||||||||||||||||||
Bruce E. Stern | $470,000 | $855,240 | $21,644 | $1,184,061 | $1,456,441 | $3,987,386 |
| $500,000 |
|
| $1,099,296 |
|
| $19,956 |
|
| $1,335,354 |
|
| $1,517,303 |
|
| $4,471,909 |
| ||||||||||||||||||||||||
| (1) | No unvested PRP payments are payable upon a termination without cause. |
| (2) | The value of the PSUs for this table was determined as if the applicable performance period ended on December 31, |
CHANGE-IN-CONTROL SEVERANCE (1)
Name | Salary Continuation | Cash Incentive Compensation | Benefits | Unvested RSUs | Unvested PSUs(2) | Total | ||||||||||||||||||
Dominic J. Frederico |
| $1,250,000 |
|
| $4,278,313 |
|
| $48,044 |
|
| $10,360,720 |
|
| $17,634,014 |
|
| $33,571,091 |
| ||||||
Robert A. Bailenson |
| $700,000 |
|
| $1,785,815 |
|
| $32,190 |
|
| $2,587,717 |
|
| $4,404,113 |
|
| $9,509,835 |
| ||||||
Ling Chow |
| $525,000 |
|
| $986,933 |
|
| $32,190 |
|
| $1,791,681 |
|
| $1,558,523 |
|
| $4,894,327 |
| ||||||
Russell B. Brewer II |
| $525,000 |
|
| $1,437,188 |
|
| $19,956 |
|
| $1,988,202 |
|
| $3,389,433 |
|
| $7,359,779 |
| ||||||
Bruce E. Stern |
| $500,000 |
|
| $1,099,296 |
|
| $19,956 |
|
| $1,335,354 |
|
| $2,280,720 |
|
| $5,235,326 |
| ||||||
| (1) | No unvested PRP payments are payable upon a change in control. |
| (2) |
CHANGE-IN-CONTROL SEVERANCE
| Name | Salary Continuation | Cash Incentive Compensation | Benefits | Unvested RSUs | Unvested PSUs(1) | Total | ||||||||||||||||||
Dominic J. Frederico | $1,250,000 | $4,042,979 | $42,846 | $8,812,771 | $14,645,899 | $28,794,495 | ||||||||||||||||||
Robert A. Bailenson | $625,000 | $1,290,557 | $31,644 | $1,983,834 | $3,263,384 | $7,194,419 | ||||||||||||||||||
James M. Michener(2) | $625,000 | $1,479,333 | $42,846 | $1,719,885 | $2,898,040 | $6,765,104 | ||||||||||||||||||
Russell B. Brewer II | $500,000 | $1,077,827 | $31,644 | $1,832,299 | $3,068,670 | $6,510,440 | ||||||||||||||||||
Bruce E. Stern | $470,000 | $855,240 | $21,644 | $1,184,061 | $1,988,903 | $4,519,848 | ||||||||||||||||||
| For PSUs, the applicable performance period would end on the date of a change in control and the amount which would become vested would be determined based on the performance through such date. |
56
The salary continuation, cash incentive compensation and benefits columns in the Termination Without Cause Payments table and theChange-in-Control Severance table represent amounts that would be payable to each executive officer under the terms of the severance policy for executive officers. Under the terms of the policy, each named executive officer receives one year of salary, the average of the last three annual cash incentive compensation amounts, apro-rata annual cash incentive compensation payment for the year of termination and one year of benefits which represent medical plan and dental plan premiums paid by our Company at the same level as was paid just prior to termination.
For the purpose of these tables, the value of RSUs and PSUs has been determined by multiplying the number of shares of that would have become vested on December 31, 20172019 based on each applicable termination described above and based on target performance
60
or the actual performance determined as if the performance period ended on such date by the closing price of our Common Shares on December 31, 2017,2019, which was $33.87.$49.02.
In addition to the amounts listed in the tables, upon a termination of employment for any of the reasons described above, the executives would be entitled to distributions from the qualified andnon-qualified defined contribution retirement plans maintained by the Company and affiliates. For the named executive officers, the aggregate qualified andnon-qualified defined contribution retirement account balances as of December 31, 20172019 for Messrs.Mr. Frederico, Mr. Bailenson, Michener,Ms. Chow, Mr. Brewer and Mr. Stern are as follows, respectively: $8,823,458, $6,043,347, $4,213,889, $7,336,359$12,644,961, $8,664,917, $4,111,822, $8,774,357 and $3,667,991.$4,488,991. Retirement account balances will be paid upon termination in accordance with the terms of the plans, as described below.
If an executive officer had been terminated for cause on December 31, 2017,2019, he or she would not have received any severance payments and would have forfeited all unvested PRP, RSUs and PSUs, receiving only salary payments through the termination date and vested retirement benefits under our Company’s retirement plans.
Severance payments, restricted stock vesting and retirement plan contributions assume no subsequent employment after termination. Certain rights to vesting and distributions following retirement or a termination without cause are subject to continued compliance with applicable restrictive covenants and may be forfeited by the executive in the event of a violation of such covenants (and in certain circumstances, the executive may be required to repay certain amounts in the event of a violation of such covenants).
See “Compensation Disclosure and Analysis—Separation Agreement” for a description of Mr. Michener’s Separation Agreement.
In 2017,2019, the annual total compensation of Dominic J. Frederico, our President and Chief Executive Officer was $13,526,784.$12,153,470. The annual total compensation of our median employee was $234,048.$255,268. As a result, the ratio of the annual total compensation of our CEO to our median employee was 57.847.6 to 1.
We identified the median employee by examining the 20172019 annual total compensation for all individuals, excluding our CEO, who were employed by us on December 31, 2017. We2019, other than the approximately 116 employees of BlueMountain and associated entities, which we acquired on October 1, 2019. Except for such excluded employees, which we refer to as BlueMountain employees, we included all employees, whether employed on a full-time or part-time basis, and including allnon-BlueMountain employees resident outside of the U.S. We did not make any assumptions, adjustments or estimates with respect to annual total compensation. We annualized the compensation for any full-timenon-BlueMountain employees who were not employed by us for all of 2017.2019. We calculated the total compensation for our CEO and all of ournon-BlueMountain employees excluding our CEO using the same methodology we use to calculate Total Annual Compensation for our named executive officers as set forth in the 20172019 Summary Compensation table on page 52 earlier in this proxy statement.
NON-QUALIFIED RETIREMENT PLANS
All the executive officers participate in anon-qualified defined contribution retirement plan through an Assured Guaranty employer. These plans generally permit distributions only following a participant’s termination of employment, and each of the plans imposes some additional restrictions on distributions as described below. A change in control under the current provisions of these plans does not entitle a participant to payment. Below is an overview of each plan.
AG US GROUP SERVICES INC. SUPPLEMENTAL EXECUTIVE RETIREMENT PLAN (AGUS SERP)
The AG US Group Services Inc. Supplemental Executive Retirement Plan, which we refer to as the AGUS SERP, is anon-qualified retirement plan for higher-paid employees. Internal Revenue Code provisions, such as the annual limit on employee deferrals, limit the amount of contributions that these employees may make or have made on their behalf to the qualified AG US Group Services Inc.
57
Employee Retirement Plan. Contributions credited to this supplemental plan mirror the employee contributions, employer matching contributions, and 6% employer core contributions that would have been made under the AG US Group Services Inc. Employee Retirement Plan had the Internal Revenue Code provisions not limited the contributions. The plan also permits discretionary employer contributions.contributions (with the employer matching and core contributions to the supplemental plan capped at a limit of 6% of eligible compensation).
A participant does not vest in employer contributions until he or she has completed one year of service, but the participant will vest earlier if he or she dies or attains age 65 while employed by a specified Assured Guaranty employer.
Distribution of a participant’s account balances will be made as a lump sum. However, a participant may elect to receive payment of his or her account balances in annual installments over a period not exceeding five years, but only if, at the time of termination, the participant has attained age 55 and completed at least five years of service, and the amount of the participant’s account balances is at least $50,000.
A participant who is considered to be a specified employee as defined in Section 409A of the Internal Revenue Code and whose payment of benefits begins by reason of termination of employment may not begin to receive such payment until six months after termination of employment.
ASSURED GUARANTY LTD. SUPPLEMENTAL EMPLOYEE RETIREMENT PLAN (AGL SERP)
The Assured Guaranty Ltd. Supplemental Executive Retirement Plan, which we refer to as the AGL SERP, is anon-qualified retirement plan for higher-paid employees. Internal Revenue Code provisions, such as the annual limit on employee deferrals, limit the amount of contributions that these employees may make or have made on their behalf to the qualified Assured Guaranty Ltd. Employee Retirement Plan. To satisfy the requirements of Section 457A of the Internal Revenue Code, U.S. taxpayers did not accrue additional benefits under the AGL SERP on and after January 1, 2009, and, as permitted by Sections 409A and 457A of the Internal Revenue Code, the AGL SERP was amended to require the distribution in 2017 of all benefits that were accrued prior to January 1, 2009 and that would otherwise have been subject to Section 457A of the Internal Revenue Code. Accrued benefits of executive officers in the AGL SERP (other than participant account balances invested in the employer stock fund) were transferred from the AGL SERP to the Assured Guaranty Corp. Supplemental Executive Retirement Plan, which we refer to as the AGC SERP, in 2012. Accrued benefits of executive officers in the AGC SERP were transferred from the AGC SERP to the AGUS SERP effective January 1, 2017. The remaining balances held by executive officers in the AGL SERP were invested in the employer stock fund and were distributed as Common Shares in a singlelump-sum payment on January 6, 2017 to satisfy the requirements of Sections 409A and 457A of the Internal Revenue Code. On the day such distributions were made to the Company’s Chief Executive Officer and to the Company’s General Counsel, the Company repurchased a like number of Common Shares from such officers. See “What Related Person Transactions Do We Have?” Following such distribution, no executive officers have any accrued benefits remaining in the AGL SERP. Any additional benefits for the executive officers accrue in the AGUS SERP described above.61
All the executive officers have previously received awards pursuant to our Company’s long-term incentive plan and in prior years received awards under our Company’s PRP. For the 20172018 performance year, in 2018,2019, the executive officers received a grant of performance share units and RSUs as described below, but did not receive a grant of PRP. Below is an overview of the plans.
ASSURED GUARANTY LTD. 2004 LONG-TERM INCENTIVE PLAN
The 2004 Long-Term Incentive Plan, as amended, provides for the grant ofnon-qualified and incentive stock options, stock appreciation rights, full value awards, which include awards such as restricted shares, RSUs or performance share units, and cash incentive awards to employees selected by the Compensation Committee. The Compensation Committee specifies the terms of the award, including the vesting period applicable to the award, at the time it grants the award to the employee, and includes the terms in an award agreement between the employee and our Company.
PSUs were granted in 20152017 through 20182020 that will vest at the end of a three-year performance period if certain performance conditions (basedare satisfied (for PSUs granted through 2018, based on the highest40-day average share price during the last eighteen months of such period exceeding certain share price hurdles) are satisfiedhurdles, and for PSUs granted in 2019 and 2020, based on growth in core adjusted book value per share relative to a target and on TSR relative to the Index) and if the participant continues to be employed through the end of such three-year period, with limited exceptions as described below.
The participant is entitled topro-rata vesting of the performance share units in the event of termination prior to the end of the vesting period due to death or disability, an involuntary termination without cause, a voluntary termination for good reason or, a voluntary termination due to retirement, if certain requirements are met and if, and only to the extent that, the performance conditions are satisfied at the end of the applicable performance period. In the event of a change in control, the performance share units vest only to the extent that the performance conditions are satisfied at the time of the change in control and only if the participant remains employed through the end of the three-year performance period, provided, however that the vesting of the performance share units shall be accelerated following such change in control in the event of termination following the change in control but prior to the end of the vesting period due to death or disability, an involuntary termination without cause, a voluntary termination for good reason or in the event that the acquirer does not agree to continue such award following the change in control.
58
ASSURED GUARANTY LTD. PERFORMANCE RETENTION PLAN
The Performance Retention Plan was established in 2006 to permit the grant of cash-based awards to selected employees and give to the Compensation Committee greater flexibility in establishing the terms of performance retention awards, including the ability to establish different performance periods and performance objectives. PRP awards may be treated as nonqualified deferred compensation subject to the rules of Section 409A of the Internal Revenue Code. The PRP is asub-plan under our Company’s Long-Term Incentive Plan (enabling awards under the plan to be performance based compensation exempt from the $1 million limit on tax deductible compensation).
From 2008 through 2014, our Company integrated PRP awards into its long-term incentive compensation program for the executive officers and certain selected employees. The executive officers stopped receiving PRP awards beginning in 2015 and the last outstanding PRP award to anyone who was an executive officer as of December 31, 2017 vested on December 31, 2017. However, Ms. Chow was granted PRP awards before becoming an executive officer, including in February 2017, so her last PRP award is expected to vest on December 31, 2020. Generally, for outstanding awards granted before 2020, each PRP award is divided into three installments, with 25% of the award allocated to a performance period that includes the year of the award and the next year, 25% of the award allocated to a performance period that includes the year of the award and the next two years, and 50% of the award allocated to a performance period that includes the year of the award and the next three years. Each installment of an award vests if the participant remains employed through the end of the performance period for that installment (or vests on the date of the participant’s death, disability, or retirement if that occurs during the performance period). Payment for each performance period is made at the end of that performance period. One half of each installment is increased or decreased in proportion to the increase or decrease of core ABV per share during the performance period, and one half of each installment is increased or decreased in proportion to the core operating ROE during the performance period. However, if, during the performance period, a participant dies or becomes permanently disabled while employed, the amount for any such incomplete performance period shall equal the portion of the award allocated to such performance period. Core operating ROE and core ABV are defined in each PRP award agreement.
In the case of outstanding PRP awards granted to the executive officers, if a payment would otherwise be subject to the $1 million limit on tax deductible compensation, no payment will be made unless performance satisfies a minimum threshold—for the applicable performance period, there must be positive growth in our core ABV per share and our core operating ROE must have been at least 3% on average for each year in the applicable performance period. If a payment is forfeited because the minimum threshold is not satisfied, but in a subsequent performance period, there is either positive growth in our core ABV per share or our core operating ROE is at least 3% on average for each year in the applicable performance period, and the executive officer remains employed at our Company, then the executive officer will receive the forfeited payment.
5962
EQUITY COMPENSATION PLANS INFORMATION
The following table summarizes our equity compensation plans as of December 31, 2017:2019:
Plan category
| Number of exercise of
| Weighted
|
Number of
| Number of exercise of | Weighted average exercise price of outstanding options, warrants and rights (b) | Number of securities remaining available for future issuance under equity compensation plans (excluding securities reflected in column (a)) (c) | ||||||||||||||||||
Equity compensation plans approved by security holders
|
|
1,029,855
|
(1)
|
$
|
17.48
|
|
|
10,124,066
|
(2)
|
| 90,351(1) |
| $ | 20.68 |
|
| 9,569,997(2) |
| ||||||
Equity compensation plans not approved by security holders
|
|
N/A
|
|
|
N/A
|
|
|
N/A
|
|
| N/A |
|
| N/A |
|
| N/A |
| ||||||
TOTAL
|
|
1,029,855
|
|
$
|
17.48
|
|
|
10,124,066
|
|
| 90,351 |
| $ | 20.68 | 9,569,997 | |||||||||
| (1) | Includes Common Shares to be issued upon exercise of outstanding stock options and performance stock options granted under the Assured Guaranty Ltd. 2004 Long-Term Incentive Plan. Does not include purchase rights currently accruing under the Assured Guaranty Ltd. Employee Stock Purchase Plan because the purchase price (and therefore the number of shares to be purchased) will not be determined until the end of the purchase period, which is June 30, |
| (2) | Includes |
6063
The Audit Committee consists of four members of the Board of Directors. After reviewing the qualifications of the current members of the Audit Committee and any relationships they may have with our Company that might affect their independence from our Company, the Board of Directors has determined that:
each Audit Committee member is independent, as that concept is defined in Section 10A of the Exchange Act, the SEC rules promulgated thereunder, and the NYSE listing standards, of our Company and our management;
each Audit Committee member is financially literate, as contemplated by the NYSE listing standards; and
each Audit Committee member is an audit committee financial experts,expert, as that term is defined under Item 407(d) ofRegulation S-K.
The Audit Committee operates under a written charter approved by the Board of Directors, a copy of which is available on our website atwww.assuredguaranty.com/governance.governance. Each year, the Audit Committee reviews the charter and reports to the Board of Directors on its adequacy. As more fully described in the charter, the primary purpose of the Audit Committee is to assist the Board of Directors in its oversight of the integrity of our financial statements and financial reporting process; our compliance with legal and regulatory requirements and ethics programs as established by management; the system of internal accounting and financial controls; the audit process; the role and performance of our internal audit process; and the performance, qualification and independence of our independent auditor.
The Audit Committee annually evaluates the performance of our Company’s independent auditor and provides assistance to the members of the Board of Directors in fulfilling their oversight of the financial reporting practices, including satisfying obligations imposed by Section 404 of the Sarbanes Oxley Act of 2002, and the financial statements of our Company. The Audit Committee selects the independent auditor for the Board of Directors to recommend to the shareholders to appoint. Our Company’s current independent auditor is PricewaterhouseCoopers LLP, which we refer to as PwC.
PwC has served as our independent auditor since 2003. The Audit Committee believes there are significant benefits to having an independent auditor with an extensive history with the Company, including higher quality audit work and accounting advice, due to PwC’s institutional knowledge of our business and operations, accounting policies and financial systems, and internal control framework and operational efficiencies.
Subject to our Company’s shareholders’ statutory right to set the terms of engagement for our independent auditor, including setting the remuneration of the independent auditor and authorizing the Board of Directors, through the Audit Committee, annually to set such terms of engagement, the Audit Committee contracts with and sets the fees paid to our independent auditor. The fees for services for PwC’s audit services the past two fiscal years are set forth under Proposal No. 3: Appointment of Independent Auditor. Audit fees relate to professional services rendered for the audit of our consolidated financial statements, audits of the statutory financial statements of certain subsidiaries, review of quarterly consolidated financial statements and audit of internal control over financial reporting as required under Sarbanes Oxley Section 404.
The Audit Committee also determines that thenon-audit services provided to our Company by the independent auditor are compatible with maintaining the independence of the independent auditor. The Audit Committee’spre-approval policies and procedures are discussed under Proposal No. 3: Appointment of Independent Auditor.
The Audit Committee annually conducts an evaluation of the independent auditor to determine if it will recommend the retention of the independent auditor. The Audit Committee is also involved in evaluating the qualifications and performance of the engagement team and lead partner. As part of the evaluation of the independent auditor, the engagement team and lead partner, the Audit Committee surveys select Company management and all members of the Audit Committee to evaluate the historical and recent performance of the independent auditor and to determine if the independent auditor is meeting our Company’s expectations. Among other things, the Audit Committee considers PwC’s independence, professional skepticism and objectivity, the quality and candor of PwC’s communications with the Audit Committee and management, the quality and efficiency of the services provided by PwC, and the depth of PwC’s understanding of the Company’s business, operations and systems, including the potential effect on the financial statements of major risk and exposures facing the Company. In addition, the Audit Committee obtains and reviews, at least annually, a report by the independent auditor describing:
the firm’s internal quality-control procedures;
any material issues raised by the most recent internal quality-control review, or peer review, of the firm, or by any inquiry or investigation of the firm by governmental or professional authorities, within the preceding five years, and any steps taken to deal with any such issues; and
6164
to assess the independent auditors’ independence, all relationships between the independent auditor and the Company.
The Audit Committee is also involved in evaluating the qualifications and performance of the engagement team and the lead partner. The Audit Committee considers the experience of the independent auditor in auditing companies in the financial guaranty insurance industry and considers the effect of changing independent auditors when assessing whether to retain the current independent auditor. Based upon the foregoing, and in light of the quality of audit services and sufficiency of resources provided, the Audit Committee believes choosing PwC as our Company’s independent auditor would be in the best interest of the Company and its shareholders and recommends the retention of PwC as our Company’s independent auditor for 2017.2020.
Our Company’s management prepares our consolidated financial statements in accordance with U.S. GAAP and is responsible for the financial reporting process that generates these statements. Management is also responsible for establishing and maintaining adequate internal controls over financial reporting and for performing an assessment of the effectiveness of these controls. PwC audits ouryear-end financial statements and reviews interim financial statements. PwC also audits the effectiveness of our internal controls over financial reporting. The Audit Committee, on behalf of the Board of Directors, monitors and reviews these processes, acting in an oversight capacity relying on the information provided to it and on the representations made to it by our management, PwC and other advisors. We have also retained Ernst & Young LLP, which we refer to as E&Y, to provide services to support our Company’s internal audit program and compliance with Section 404 of the Sarbanes Oxley Act of 2002.
During the last year, and earlier this year in preparation for the filing with the SEC of the Company’sForm 10-K, the Audit Committee:
reviewed and discussed the audited financial statements contained in theForm 10-K with management and PwC;
reviewed and discussed our quarterly earnings press releases and related materials;
reviewed the overall scope and plans for the internal and independent audits and the results of such audits;
reviewed critical accounting estimates and policies and the status of our loss reserves;
reviewed and discussed our compliance with our conflict of interest, regulatory compliance and code of conduct policies with the General Counsel or Deputy General Counsel;Chief Compliance Officer;
reviewed and discussed our underwriting and risk management with the Chief Risk Officer, the Chief Surveillance Officer and the Chief Credit Officer, coordinating the oversight of underwriting and risk management with the Risk Oversight Committee;
reviewed our compliance with the requirements of Sarbanes Oxley Section 404 and our internal controls over financial reporting, including controls to prevent and detect fraud;
reviewed our whistleblower policy and its application;
discussed with PwC all the matters required to be discussed by U.S. GAAP, including those described in Auditing Standard No. 1301, Communications with Audit Committees,the matters required to be discussed by the applicable requirements of the Public Accounting Oversight Board and the SEC, such as:
| – | PwC’s judgments about the quality, not just the acceptability, of our Company’s accounting principles as applied in our financial reporting; |
| – | methods used to account for significant unusual transactions; |
| – | the effect of significant accounting policies in controversial or emerging areas for which there is a lack of authoritative guidance or consensus; |
| – | the process used by management in formulating particularly sensitive accounting estimates and the basis for PwC’s conclusions regarding the reasonableness of those estimates; |
| – | disagreements with management (of which there were none) over the application of accounting principles, the basis for management’s accounting estimates, and disclosures in the financial statements; and |
| – | any significant audit adjustments and any significant deficiencies in internal control; |
reviewed and discussed with PwC critical audit matters (CAMs) as disclosed in their audit report on our consolidated financial statements;
reviewed all other material written communications between PwC and management; and
discussed with PwC their independence from our Company and management, including a review of audit andnon-audit fees, and reviewed in that context the written disclosures and the letter required by the applicable requirements of the Public Company Accounting Oversight Board regarding the independent auditor’s communications with the Audit Committee concerning independence.
At each quarterly meeting, E&Y has the opportunity to address pending issues with the Audit Committee and semi-annually specifically reviews the results of internal audits and the overall internal audit program.
6265
At each meeting, the Audit Committee meets in executive session (i.e., without management present) with representatives of PwC to discuss the results of their examinations and their evaluations of our internal controls and overall financial reporting. Similar executive sessions are held at least semi-annually with representatives of E&Y. In addition, the Audit Committee meets regularly with certain members of senior management in separate sessions.
Based on the review and discussions referred to above, and in reliance on the information, opinions, reports or statements presented to the Audit Committee by our Company’s management and PwC, the Audit Committee recommended to the Board of Directors that the December 31, 20172019 audited consolidated financial statements be included in our Company’s Annual Report onForm 10-K.
The foregoing report has been approved by the Audit Committee.
G. Lawrence Buhl, Chairman
Bonnie L. Howard
Thomas W. Jones
Alan J. Kreczko
Michael T. O’Kane
6366
ADVISORY APPROVAL OF EXECUTIVE COMPENSATION
Our shareholders have the opportunity to cast an advisory (nonbinding) vote to approve the compensation of our named executive officers as disclosed in this proxy statement in accordance with the SEC’s compensation disclosure rules. This vote is being conducted in accordance with the requirements of Section 14A of the Exchange Act and the related rules of the SEC. Proposal No. 2 is Item 2 on the proxy card.
As described in detail under the heading “Executive Compensation—Compensation Discussion and Analysis,” our executive compensation program is designed to attract, motivate, and retain talented executives who possess the skills required to formulate and drive our Company’s strategic direction and achieve annual and long-term performance goals necessary to create shareholder value. The program seeks to align executive compensation with shareholder value on an annual and long-term basis through a combination of base pay, annual incentives and long-term incentives. The Compensation Committee continually reviews the compensation programs for our named executive officers to ensure they achieve the desired goals of aligning our executive compensation structure with our shareholders’ interests and current market practices. Please read the “Compensation Discussion and Analysis” discussion for additional details about our executive compensation programs, including information about the fiscal year 20172019 compensation of our named executive officers.
We believe that our executive compensation programs are structured in the best manner possible to support our Company and our business objectives. We are asking our shareholders to indicate their support for our named executive officer compensation as described on pages 1922 to 5961 of this proxy statement, which include the “Compensation Discussion and Analysis” section and the compensation tables and related narrative disclosure. This proposal, commonly known as a“say-on-pay” proposal, gives our shareholders the opportunity to express their views on our named executive officers’ compensation. This vote is not intended to address any specific item of compensation, but rather the overall compensation of our named executive officers and the philosophy, policies and practices described in this proxy statement.
| The board of directors recommends that you vote “FOR” the following resolution at the Annual General Meeting: |
“RESOLVED, that the compensation paid to the Company’s named executive officers, as disclosed pursuant to the compensation disclosure rules of the SEC, including the compensation discussion and analysis, the compensation tables and any related material disclosed in this proxy statement, including the Compensation Discussion and Analysis, compensation tables and narrative discussion is hereby APPROVED.”
Thesay-on-pay vote is advisory, and therefore not binding on our Company, the Compensation Committee or the Board of Directors. However, the Board of Directors and the Compensation Committee value the opinions of our shareholders and will review the voting results carefully. To the extent there is any significant vote against the named executive officer compensation as disclosed in this proxy statement, we will consider our shareholders’ concerns and the Compensation Committee will evaluate whether any actions are necessary to address those concerns.
6467
APPOINTMENT OF INDEPENDENT AUDITOR
The appointment of our independent auditor is approved annually by our shareholders, who also annually authorize the Board of Directors, acting through its Audit Committee, to set the remuneration for our independent auditor. Proposal No. 3 is Item 3 on the proxy card.
At the recommendation of the Audit Committee, the Board of Directors recommends that shareholders appoint PricewaterhouseCoopers LLP as our independent auditor for the year ending December 31, 20182020 and that shareholders authorize the Board of Directors, acting through its Audit Committee, to set the fees for our independent auditor. In making its recommendation with respect to the engagement of our independent auditor, the Audit Committee reviewed both the audit scope and estimated fees for professional services for the coming year.
PwC served as our independent auditor for the year ended December 31, 2017.2019. Our audited financial statements for the year ended December 31, 20172019 will be presented at the Annual General Meeting. Representatives of PwC will attend the Annual General Meeting and will have an opportunity to make a statement if they wish. They will also be available to answer questions at the meeting.
INDEPENDENT AUDITOR FEE INFORMATION
The following table presents fees for professional audit services rendered by PwC for the audit of our annual consolidated financial statements for 20172019 and 20162018 and fees for other services rendered by PwC in 20172019 and 2016.2018.
| 2019 | 2018 | |||||||||||||||
| 2017 | 2016 | |||||||||||||||
Audit fees(1) | $ | 8,353,000 | $ | 6,571,000 | $ | 7,906,500 | $ | 6,610,000 | ||||||||
Audit-related fees(2) | $553,000 | $ | 1,164,000 | $ | 2,285,000 | $ | 678,000 | |||||||||
Tax fees(3) | $169,500 | $878,500 | $ | 250,000 | $ | 165,000 | ||||||||||
All other fees(4) | $4,000 | $55,532 | $ | 494,000 | $ | 35,000 | ||||||||||
| (1) | We paid audit fees, including costs, for the years ended December 31, |
the audits of our consolidated financial statements, of management’s assessment of internal controls over financial reporting and of the effectiveness of these controls
the statutory and GAAP audits of various subsidiaries
review of quarterly financial statements
| (2) | Audit-related fees for the year ended December 31, |
Audit-related fees for the year ended December 31, |
| (3) | Of the total amount of tax fees for |
| compliance. Compliance-related tax fees for |
| (4) | Fees for |
PwC also provides audit services to certain unconsolidated funds managed and advised by Assured Guaranty Ltd. subsidiaries. Fees related to these audits were $4.2 million in 2019 and are not reflected in the table above.
65
68
PRE-APPROVAL POLICY OF AUDIT ANDNON-AUDIT SERVICES
The Audit Committeepre-approved all of the fees described above. The Audit Committee has adopted policies and procedures for thepre-approval of all audit and permissiblenon-audit services provided by our independent auditor, PwC. The Audit Committee provides a generalpre-approval of certain audit andnon-audit services on an annual basis. The types of services that may be covered by a generalpre-approval include other audit services, audit-related services and permissiblenon-audit services. If a type of service is not covered by the Audit Committee’s generalpre-approval, the Audit Committee must review the service on a specific case by case basis andpre-approve it if such service is to be provided by the independent auditor. Annual audit services engagement terms and fees require specificpre-approval of the Audit Committee and management and the auditor will report actual fees versus the budget periodically throughout the year by category of service. Any proposed services exceedingpre-approved costs also require specificpre-approval by the Audit Committee. For both types ofpre-approval, the Audit Committee will consider whether such services are consistent with the SEC’s rules on auditor independence. Either the Audit Committee Chairman or the entire Audit Committee mustpre-approve the provision of any significant additional audit fees in excess of the budgeted amount and/or any excess related tonon-audit fees over the budgeted amount. All fees related to internal control work arepre-approved by the Audit Committee before such services are rendered. The Audit Committeepre-approved all of the fees described above pursuant to itspre-approval policies and procedures.
| The |
6669
PROPOSALS CONCERNING OUR SUBSIDIARY, ASSURED GUARANTY RE LTD.
In accordance with AGL’sBye-Laws, if AGL is required or entitled to vote at a general meeting of any directnon-United States subsidiary of AGL, AGL’s directors must refer the matter to the shareholders of AGL and seek authority from AGL’s shareholders for AGL’s representative or proxy to vote in favor of the resolution proposed by the subsidiary. AGL’s directors must cause AGL’s representative or proxy to vote AGL’s shares in the subsidiary pro rata to the votes received at the general meeting of AGL. In addition, AGL’s Board of Directors, in its discretion, may require that the organizational documents of each subsidiary of AGL organized under the laws of a jurisdiction outside the United States contain provisions substantially similar to these provisions. As a consequence, we are proposing that our shareholders authorize AGL to vote in favor of the following matters to be presented at the next annual general meeting of our subsidiary, Assured Guaranty Re Ltd., which we refer to as AG Re.
PROPOSAL 4.1—ELECTION OF AG RE DIRECTORS
We propose that AGL be directed to elect the following eight directors of AG Re: Howard W. Albert, Robert A. Bailenson, Russell B. Brewer, II, Gary Burnet, Ling Chow, Stephen Donnarumma, Dominic J. Frederico, and Walter A. Scott, with such persons constituting the entire board of directors of AG Re, to serve for one year terms commencing at the annual general meeting of AG Re. Other than Mr. Scott, each nominee is an officer of AGL or one of its subsidiaries and each, including Mr. Scott, has consented to serve as a director of AG Re without fee if elected. Mr. Scott will receivewas entitled to a director’s feesfee of $5,000 per annum if elected.for his service in 2019, but declined. We do not expect that any of the nominees will become unavailable for election as a director of AG Re, but if any nominees should become unavailable prior to the meeting, proxy cards, whether submitted by telephone, via the Internet or by mail, authorizing the proxies to vote for the nominees will instead be voted for substitute nominees recommended by AG Re’s board of directors. Proposal 4.1 is Item 4A on the proxy card.
The biographies for these nominees are set forth below:
HowardW. Albert, age 58,60, has been Chief Risk Officer of AGL since May 2011. Prior to that, he was Chief Credit Officer of AGL from 2004 to April 2011. Mr. Albert joined Assured Guaranty in September 1999 as Chief Underwriting Officer of Capital Re Company, the predecessor to AGC. Before joining Assured Guaranty, he was a Senior Vice President with Rothschild Inc. from February 1997 to August 1999. Prior to that, he spent eight years at Financial Guaranty Insurance Company from May 1989 to February 1997, where he was responsible for underwriting guaranties of asset-backed securities and international infrastructure transactions. Prior to that, he was employed by Prudential Capital, an investment arm of The Prudential Insurance Company of America, from September 1984 to April 1989, where he underwrote investments in asset-backed securities, corporate loans and project financings.
Mr. Albert’s experience in risk management, underwriting and credit and his position as the Chief Risk Officer of AGL make him valuable to the Board of Directors of AG Re.
RobertA. Bailenson, age 51,53, has been the Chief Financial Officer of AGL since June 2011. Mr. Bailenson has been with Assured Guaranty and its predecessor companies since 1990. Mr. Bailenson became Chief Accounting Officer of AGC in 2003, of AGL in May 2005, and of AGM in July 2009, and has been Chief Accounting Officer of AGL sinceserved in such capacities until May 2005 and Chief Accounting Officer of AGC since 2003.2019. He was Chief Financial Officer and Treasurer of AG Re from 1999 until 2003 and was previously the Assistant Controller of Capital Re Corp., the Company’s predecessor.
Mr. Bailenson’s background as the Chief Financial Officer of AGL and as an accountant provides an important perspective to the Board of Directors of AG Re.
Russell B. Brewer II, age 61,63, has been Chief Surveillance Officer of AGL since November 2009 and Chief Surveillance Officer of AGC and AGM since July 2009 and has also been responsible for information technology at AGL since April 2015. Mr. Brewer has been with AGM since 1986. Mr. Brewer was Chief Risk Management Officer of AGM from September 2003 until July 2009 and Chief Underwriting Officer of AGM from September 1990 until September 2003. Mr. Brewer was also a member of the Executive Management Committee of AGM. He was a Managing Director of Assured Guaranty Municipal Holdings Inc. from May 1999 until July 2009. From March 1989 to August 1990, Mr. Brewer was Managing Director, Asset Finance Group, of AGM. Prior to joining AGM, Mr. Brewer was an Associate Director of Moody’s Investors Service, Inc.
6770
Mr. Brewer’s risk management and surveillance expertise and his position as the Chief Surveillance Officer of AGL enhance the deliberations of the Board of Directors of AG Re.
Gary Burnet,age 47,49, has been President of AG Re since August 2012, and prior to that he served as the Managing Director—Chief Credit Officer of AG Re from 2006 until his appointment as President. Mr. Burnet also served as the Vice President—Risk Management and Operations of AG Re from 2002 to 2005. Prior to joining our Company, Mr. Burnet’s previous experience included two years at ACE Asset Management, where he was Investment Officer with responsibility for developing and modeling the ACE group’s consolidated investment and insurance credit risk. Prior to ACE Asset Management, he was an Assistant Vice President—Investments at ACE Bermuda. Mr. Burnet trained as a Chartered Accountant with Geoghegan & Co. CA from 1993 to 1996 in Edinburgh Scotland and also worked as an audit senior for Coopers & Lybrand from 1996 to 1998 in Bermuda.
As the President of AG Re, Mr. Burnet has the most comprehensive knowledge of its operations, including the key areas of underwriting credit risk, accounting and risk management.
Ling Chow, age 47,49, has been General Counsel and Secretary of AGL since January 1, 2018. She is responsible for legal affairs and corporate governance at the Company, including its litigation and other legal strategies relating to distressed credits, and its corporate, compliance, regulatory and disclosure efforts. Ms. Chow previously served as Deputy General Counsel and Assistant Secretary of AGL from May 2015 and as Assured Guaranty’s U.S. General Counsel from June 2016. Prior to that, Ms. Chow served as Deputy General Counsel of Assured Guaranty’s U.S. subsidiaries in several capacities from 2004. Before joining Assured Guaranty in 2002, Ms. Chow was an associate at various law firms, most recently Brobeck, Phleger & Harrison LLP, Cahill Gordon & Reindelwhere she was a senior associate responsible for transactional work associated with public and LeBoeuf, Lamb, Greene & MacRae, L.L.P.private mergers and acquisitions, venture capital investments and private and public securities offerings.
Ms. Chow’s experience as an attorney and her position as the General Counsel of AGL enablesenable her to make valuable contributions as a member of the Board of Directors of AG Re.
Stephen Donnarumma, age 55,57, was appointed as a director of AG Re on September 11, 2012. Mr. Donnarumma has been the Chief Credit Officer of AGC since 2007, of AGM since its 2009 acquisition, and of MAC since its 2012 capitalization. Mr. Donnarumma has been with Assured Guaranty since 1993. Over the past 25 years, Mr. Donnarumma has held a number of positions at Assured Guaranty, including Deputy Chief Credit Officer of AGL, Chief Operating Officer and Chief Underwriting Officer of AG Re, Chief Risk Officer of AGC, and Senior Managing Director, Head of Mortgage and Asset-backed Securities of AGC. Prior to joining Assured Guaranty, Mr. Donnarumma was with Financial Guaranty Insurance Company from 1989 until 1993, where his responsibilities included underwriting domestic and international financial guaranty transactions. Prior to that, he served as a Director of Credit Risk Analysis at Fannie Mae from 1987 until 1989. Mr. Donnarumma was also an analyst with Moody’s Investors Services from 1985 until 1987.
Mr. Donnarumma’s experience with credit analysis and risk management, and his position as the Chief Credit Officer of AGM, MAC and AGC, provide important perspective to the Board of Directors of AG Re.
Dominic J. Frederico—See Mr. Frederico’s biography in “Election of Directors—Nominees for Director.” The benefits of his experience described therein with respect to the Board of Directors of AGL also make him valuable as a director of AG Re.
Walter A. Scott, age 80,82, was the Chairman of the AGL Board of Directors from May 2005 until his retirement in May 2013, and a director of AGL from 2004 through 2013. Mr. Scott was Chairman, President and Chief Executive Officer of ACE from 1991 until his retirement in 1994, and President and Chief Executive Officer of ACE from 1989 to 1991. Subsequent to his retirement he served as a consultant to ACE until 1996. Mr. Scott was a director of ACE from 1989 through May 2005. Prior to joining ACE, Mr. Scott was President and Chief Executive Officer of Primerica’s financial services operations. Mr. Scott was also the Chairman of Vermont Hard Cider Company, LLC from 2003 until 2012, when that company was sold. Mr. Scott is an Emeritus Trustee of Lafayette College and a founding trustee of the Bermuda Foundation for Insurance Studies.
Mr. Scott’s tenure on the AGL Board of Directors and lengthy experience at senior levels in the financial services industry allow him to provide valuable perspective to the Board of Directors of AG Re.
PROPOSAL 4.2—APPOINTMENT OF AG RE AUDITOR
We propose that AGL be directed to appoint PwC as the independent auditor of AG Re for the fiscal year ending December 31, 2018,2020, subject to PwC being appointed as our Company’s independent auditor. We expect representatives of PwC to be present at AGL’s Annual General Meeting with an opportunity to make a statement if they wish and to be available to respond to appropriate questions. Proposal 4.2 is Item 4B on the proxy card.
6871
The following table presents fees for professional audit services rendered by PwC for the audit of AG Re’s financial statements for 20172019 and 2016.2018.
| 2017 | 2016 | 2019 | 2018 | |||||||||||||
Audit fees | $ | 89,900 | $ | 89,900 | $ | 89,900 |
| $ | 89,900 |
| ||||||
Audit—related fees | $ | — | $ | — |
| — |
|
| — |
| ||||||
Tax fees | $ | — | $ | — |
| — |
|
| — |
| ||||||
All other fees | $ | — | $ | — |
| — |
|
| — |
| ||||||
The above audit fees are also included in the audit fees shown in “Proposal No. 3: Appointment of Independent Auditor.”
Other Matters.The Board of Directors of AGL does not know of any matter to be brought before the annual general meeting of AG Re that we have not described in this proxy statement. If any other matter properly comes before the annual general meeting of AG Re, AGL’s representative or proxy will vote in accordance with his or her judgment on such matter.
| The board of directors recommends that you direct AGL to vote “FOR” each of the proposals concerning AGL’s subsidiary, AG Re. |
6972
SHAREHOLDER PROPOSALS FOR 20192021 ANNUAL MEETING
HOW DO I SUBMIT A PROPOSAL FOR INCLUSION IN NEXT YEAR’S PROXY MATERIAL?
If you wish to submit a proposal to be considered for inclusion in the proxy material for the next Annual General Meeting, please send it to the Secretary, Assured Guaranty Ltd., 30 Woodbourne Avenue, Hamilton HM 08, Bermuda. Under the rules of the SEC, proposals must be received no later than November 21, 201825, 2020 and otherwise comply with the requirements of the SEC to be eligible for inclusion in AGL’s 20192021 Annual General Meeting proxy statement and form of proxy.
HOW DO I SUBMIT A PROPOSAL OR MAKE A NOMINATION AT AN ANNUAL GENERAL MEETING?
OurBye-Laws provide that if a shareholder desires to submit a proposal for consideration at an Annual General Meeting, or to nominate persons for election as directors, the shareholder must provide written notice of an intent to make such a proposal or nomination which the Secretary of the Company must receive at our principal executive offices no later than 90 days prior to the anniversary date of the immediately preceding Annual General Meeting. With respect to the 20192021 Annual General Meeting, such written notice must be received on or prior to February 1, 2019.5, 2021. The notice must meet the requirements set forth in ourBye-Laws. Under the circumstances described in, and upon compliance with,Rule 14a-4(c) under the Exchange Act, management proxies would be allowed to use their discretionary voting authority to vote on any proposal with respect to which the foregoing requirements have been met.
7073
INFORMATION ABOUT THE ANNUAL GENERAL MEETING AND VOTING
WHY DID I RECEIVE A NOTICE REGARDING THE AVAILABILITY OF PROXY MATERIALS IN THE MAIL INSTEAD OF A FULL SET OF PROXY MATERIALS?
In accordance with the rules of the SEC, instead of mailing a printed copy of the proxy statement, annual report and other materials (which we refer to as proxy materials) for our Annual General Meeting, we are furnishing proxy materials to shareholders on the Internet by providing a Notice Regarding the Availability of Proxy Materials (which we refer to as a Notice) to inform shareholders when the materials are available on the Internet.
If you receive the Notice by mail, you will not receive a printed copy of the proxy materials unless you specifically request one. Instead, the Notice instructs you on how you may access and review all of our proxy materials, as well as how to submit your proxy, over the Internet.
We will first make available the proxy statement, form of proxy card and 20172019 annual report to shareholders atwww.assuredguaranty.com/annualmeeting. The proxy materials will also be available atwww.proxyvote.com on or about March 21, 201825, 2020 to all shareholders entitled to vote at the Annual General Meeting. You may also request a printed copy of the proxy solicitation materials by any of the following methods: via Internet at www.proxyvote.com; by telephone at1-800-579-1639; or by sending ane-mail tosendmaterial@proxyvote.com. Our 20172019 annual report to shareholders will be made available at the same time and by the same methods. If requesting materials bye-mail, please send a blanke-mail with the information that is printed in your Notice in the box marked by the arrow in the subject line.
g | XXXX XXXX XXXX XXXX |
We elected to use electronic notice and access for our proxy materials because we believe it will reduce our printing and mailing costs related to our Annual General Meeting.
WHY HAS THIS PROXY STATEMENT BEEN MADE AVAILABLE?
Our Board of Directors is soliciting proxies for use at our Annual General Meeting to be held on May 2, 2018,6, 2020, and any adjournments or postponements of the meeting. The meeting will be held at 8:1:00 a.m.p.m. London Time at 6 Bevis Marks, London, EC3A 7BA, United Kingdom. At this writing, the novel Coronavirus responsible forCOVID-19 continues to spread and governments are taking various actions in response. If we
postpone or change the time or location of our Annual General Meeting, we will issue a press release that we will make available on our website atwww.assuredguaranty.com/annualmeeting and file with the SEC as definitive additional proxy material. If you wish to receive a physical copy of any such press release, please contact our Secretary at generalcounsel@agltd.com or (441)279-5725.
This proxy statement summarizes the information you need to vote at the Annual General Meeting. You do not need to attend the Annual General Meeting to vote your shares.
WHAT PROPOSALS WILL BE VOTED ON AT THE ANNUAL GENERAL MEETING?
The following proposals are scheduled to be voted on at the Annual General Meeting:
Our Board of Directors recommends that you vote your shares “FOR” each of the nominees and each of the foregoing proposals.
ARE PROXY MATERIALS AVAILABLE ON THE INTERNET?
Important Notice Regarding the Availability of Proxy Materials for the Annual General Meeting to be Held on Wednesday, May 2, 20186, 2020
Yes. Our proxy statement for the 20182020 Annual General Meeting, form of proxy card and 20172019 annual report to shareholders are available atwww.assuredguaranty.com/annualmeeting. The proxy materials will also be available atwww.proxyvote.com on or about March 21, 201825, 2020 to all shareholders entitled to vote at the Annual General Meeting.
You can obtain directions to attend the 20182020 Annual General Meeting by contacting Virginia Reynolds at + 44 020 7562 1920 or atvreynolds@agltd.com. vreynolds@agltd.com.
74
WHO IS ENTITLED TO VOTE?
March 8, 201813, 2020 is the record date for the Annual General Meeting. If you owned our Common Shares at the close of business on March 8, 2018,13, 2020, you are entitled to vote. On that date, 114,967,80092,270,245 of our Common Shares were outstanding and entitled to vote at the Annual General Meeting, including 50,22540,455 unvested restricted Common Shares. Our Common Shares are our only class of voting stock. On March 8, 2018,13, 2020, the closing price of our Common Shares on the New York Stock Exchange, which we refer to as the NYSE, was $34.49.$34.56.
71
HOW MANY VOTES DO I HAVE?
You have one vote for each of our Common Shares that you owned at the close of business on March 8, 2018.13, 2020.
However, if your shares are considered “controlled shares,” which ourBye-Laws define generally to include all of our Common Shares directly, indirectly or constructively owned or beneficially owned by any person or group of persons, or owned by any “United States person,” as defined in the Internal Revenue Code, and such shares constitute 9.5% or more of our issued Common Shares, the voting rights with respect to your controlled shares will be limited, in the aggregate, to a voting power of approximately 9.5%, pursuant to a formula specified in ourBye-Laws.
The Notice indicates the number of Common Shares you are entitled to vote, without giving effect to the controlled share rule described above.
WHAT IS THE DIFFERENCE BETWEEN HOLDING SHARES AS A SHAREHOLDER OF RECORD AND AS A BENEFICIAL OWNER?
Many of our shareholders are beneficial owners since they hold their shares through a stockbroker, bank or other nominee rather than as shareholders of record when they own shares directly in their own name. As summarized below, there are some differences between shares held of record and those owned beneficially.
by your broker, bank or other nominee who is considered, with respect to those shares, the shareholder of record. As the beneficial owner, you have the right to direct your broker, bank or other nominee on how to vote your shares and are also invited to attend the Annual General Meeting. However, since you are not the shareholder of record, you may only vote these shares in person at the Annual General Meeting if you follow the instructions described below under the heading “How do I Vote in Person at the Annual General Meeting?” Your broker, bank or other nominee has provided a voting instruction form for you to use in directing your broker, bank or other nominee as to how to vote your shares. You may also vote by telephone or on the Internet as described below under the heading “May I Vote by Telephone or via the Internet?” |
HOW DO I VOTE BY PROXY IF I AM A SHAREHOLDER OF RECORD?
If you are a shareholder of record and you properly submit your proxy card (by telephone, via the Internet or by mail) so that it is received by us in time to vote, your “proxy” (one of the individuals named on your proxy card) will vote your shares as you have directed. If you sign the proxy card (including electronic signatures in the case of Internet or telephonic voting) but do not make specific choices, your proxy will vote your shares as recommended by our Board of Directors (also referred to as our Board or the Board):
If any other matter is presented, your proxy will vote in accordance with the best judgment of the individuals named on the proxy card. As of the date of printingfiling this proxy statement, we knew of no matters that needed to be acted on at the Annual General Meeting other than those discussed in this proxy statement.
HOW DO I GIVE VOTING INSTRUCTIONS IF I AM A BENEFICIAL OWNER?
If you are a beneficial owner of shares, your broker, bank or other nominee will ask you how you want your shares to be voted. If you give the broker, bank or other nominee instructions, the broker, bank or other nominee will vote your shares as you direct. If your broker, bank or other nominee does not receive instructions from you about how your shares are to be voted,
75
one of two things can happen, depending on the type of proposal. According to rules of the NYSE:
It is therefore important that you provide instructions to your broker, bank or other nominee if your shares are held by a broker, bank or other nominee so that your shares can be voted with respect to directors and executive compensation, and any other matters treated asnon-routine by the NYSE.
72
MAY I VOTE BY TELEPHONE OR VIA THE INTERNET?
Yes. If you are a shareholder of record, you have a choice of voting over the Internet, voting by telephone using a toll-free telephone number or voting by requesting and completing a proxy card and mailing it in the return envelope provided. We encourage you to vote by telephone or over the Internet because your vote is then tabulated faster than if you mailed it. There are separate telephone and Internet arrangements depending on whether you are a shareholder of record (that is, if you hold your stock in your own name), or whether you are a beneficial owner and hold your shares in “street name” (that is, if your stock is held in the name of your broker, bank or other nominee).
The telephone and Internet voting procedures are designed to authenticate shareholders’ identities, to allow shareholders to give their voting instructions and to confirm that shareholders’ instructions have been recorded properly. If you vote via telephone or the Internet, you may incur costs, such as usage charges from Internet access providers and telephone companies. You will be responsible for those costs.
Whether or not you plan to attend the Annual General Meeting, we urge you to vote. Voting by telephone or over the Internet or by returning your proxy card by mail will not affect your right to attend the Annual General Meeting and vote. In order to assure that your votes, as a record holder, are tabulated in time to be voted at the Annual General Meeting, you must complete your voting over the Internet or by telephone or submit your proxy card so that it is received by 12:4:00 noonp.m. Eastern Daylight Time on
May 1, 2018.5, 2020. Similarly, in order to assure that your votes, as a beneficial holder, are tabulated in time to be voted at the Annual General Meeting, you must submit your voting instructions so that your broker will be able to vote by 11:59 a.m.p.m. Eastern Daylight Time on April 30, 2018.May 4, 2020.
MAY I REVOKE MY PROXY?
Yes. If you change your mind after you vote, you may revoke your proxy by following any of the procedures described below. If you are a shareholder of record, to revoke your proxy:
Beneficial owners who wish to change the votes submitted on their voting instruction cards should contact their respective broker, bank or other nominee to determine how and when
changes must be submitted so that the nominee can revoke and change their votes on their behalf.
If you wish to revoke your proxy or make changes to your voting instruction card, as applicable, you must do so in sufficient time to permit the necessary examination and tabulation of the subsequent proxy or revocation before the vote is taken.
HOW DO I VOTE IN PERSON AT THE ANNUAL GENERAL MEETING?
You may vote shares held directly in your name as the shareholder of record in person at the Annual General Meeting. If you choose to vote your shares in person at the Annual General Meeting, please bring the Notice Regarding the Availability of Proxy Materials containing your control number or proof of identification. Shares held in “street name” through your broker, bank or other nominee may be voted in person by you only if you obtain a signed proxy from the shareholder of record giving you the right to vote the shares. You must bring such signed proxy to the Annual General Meeting, along with an account statement or letter from the broker, bank or other nominee indicating that you are the beneficial owner of the shares and that you were the beneficial owner of the shares on March 8, 2018.13, 2020.
Even if you plan to attend the Annual General Meeting, we recommend that you vote your shares in advance as described above so that your vote will be counted if you later decide not to attend the Annual General Meeting. However, while proxy voting is subject to the time deadlines described above, shareholders attending the meeting in person may vote during the Annual General Meeting as long as they satisfy the requirements described in this section.
76
WHAT VOTES NEED TO BE PRESENT TO HOLD THE ANNUAL GENERAL MEETING?
To have a quorum for our Annual General Meeting, two or more persons must be present, in person or by proxy, representing more than 50% of the Common Shares that were outstanding on March 8, 2018.13, 2020.
WHAT VOTE IS REQUIRED TO APPROVE EACH PROPOSAL?
The affirmative vote of a majority of the votes cast on such proposal at the Annual General Meeting is required for each of:
The vote on the compensation paid to our named executive officers is advisory in nature so there is no specified requirement
73
for approval. However, the Board of Directors and the Compensation Committee value the opinions of our shareholders and will review the voting results carefully. To the extent there is any significant vote against the named executive officers’ compensation as disclosed in this proxy statement, we will consider our shareholders’ concerns and the Compensation Committee will evaluate whether any actions are necessary to address those concerns. In addition, the Compensation Committee and the Board of Directors will consider the outcome of the most recent vote on the frequency of the vote on named executive officer compensation when determining how frequently such vote will be submitted to shareholders.
HOW ARE VOTES COUNTED?
Your vote may be cast “FOR” or “AGAINST”, or you may “ABSTAIN”, with respect to each of the nominees for AGL director, with respect to directing AGL to vote for each of the nominees for director of its subsidiary AG Re, and with respect to each of the other proposals on the agenda.
If you sign (including electronic signatures in the case of Internet or telephonic voting) your proxy card with no further instructions, your shares will be voted in accordance with the recommendations of the Board. If you sign (including electronic signatures in the case of Internet or telephonic voting) your broker, bank or other nominee voting instruction card with no further instructions, your shares will be voted in the broker’s, bank’s or nominee’s discretion with respect to routine matters but will not be voted with respect tonon-routine matters. As described in “How do I Give Voting Instructions if I am a
Beneficial Owner?”, elections of directors and the advisory vote on executive compensation are considerednon-routine matters. We will appoint one or more inspectors of election to count votes cast in person or by proxy.
WHAT IS THE EFFECT OF BROKERNON-VOTES AND ABSTENTIONS?
A broker“non-vote” occurs when a broker, bank or other nominee holding shares for a beneficial owner does not vote on a particular proposal because the broker, bank or other nominee does not have discretionary voting power for that particular item and has not received instructions from the beneficial owner.
Common Shares that are beneficially owned and are voted by the beneficiary through a broker, bank or other nominee will be counted towards the presence of a quorum, even if there are brokernon-votes with respect to some proposals, as long as the broker, bank or nominee votes on at least one proposal. Common Shares owned by shareholders electing to abstain from voting with respect to any proposal also will be counted towards the presence of a quorum.
Although brokernon-votes will be counted towards the presence of a quorum, brokernon-votes will not be included in the tabulation of the shares voting with respect to elections of
directors or other matters to be voted upon at the Annual General Meeting. Therefore, “brokernon-votes” will have no direct effect on the outcome of any proposal to be voted upon at the Annual General Meeting.
While abstentions will be counted towards the presence of a quorum, abstentions will not be included in the tabulation of the shares voting with respect to elections of directors or other matters to be voted upon at the Annual General Meeting. Therefore, abstentions will have no direct effect on the outcome of any proposal to be voted upon at the Annual General Meeting.
WHAT ARE THE COSTS OF SOLICITING THESE PROXIES AND WHO WILL PAY THEM?
We will pay all the costs of soliciting these proxies. Our directors and employees may also solicit proxies by telephone, by faxe-mail or other electronic means of communication, or in person. We will reimburse banks, brokers, nominees and other fiduciaries for the expenses they incur in forwarding the proxy materials to you. Alliance Advisors, 200 Broadacres Drive, Bloomfield, New Jersey 07003, is assisting us with the solicitation of proxies for a fee of $20,000$16,500 plusout-of-pocket expenses.
WHERE CAN I FIND THE VOTING RESULTS?
We will publish the voting results in aForm 8-K that we will file with the SEC by May 8, 2018.12, 2020. You will also be able to find thisForm 8-K on our website atwww.assuredguaranty.com/sec-filings by May 8, 2018.12, 2020.
77
DO DIRECTORS ATTEND THE ANNUAL GENERAL MEETING?
Our Corporate Governance Guidelines provide that directors are expected to attend our Annual General Meeting and any special meeting of shareholders we call to consider extraordinary business transactions, unless they are unable to do so as a result of special circumstances. All of our directors then in office attended the Annual General Meeting that was held on May 3, 2017.8, 2019.
CAN A SHAREHOLDER, EMPLOYEE OR OTHER INTERESTED PARTY COMMUNICATE DIRECTLY WITH OUR BOARD? IF SO, HOW?
Our Board provides a process for shareholders, employees or other interested parties to send communications to our Board.
Shareholders, employees or other interested parties wanting to contact the Board, the independent directors, the
74
|
Communication with the Board may be anonymous. The Secretary will forward all communications to the Board to the Chairman of the Audit Committee or the Chairman of the Nominating and Governance Committee, who will determine when it is appropriate to distribute such communications to other members of the Board or to management.
WHOM SHOULD I CALL IF I HAVE ANY QUESTIONS?
If you have any questions about the Annual General Meeting or voting, please contact Ling Chow, our Secretary, at(441) 279-5725 or at generalcounsel@agltd.com. If you have any questions about your ownership of our Common Shares, please contact Robert Tucker, our Managing Director, Investor Relations and Corporate Communications, at(212) 339-0861 or at rtucker@agltd.com.
HOW DOES “HOUSEHOLDING” WORK?
Please note we may deliver a single copy of the Notice and, if applicable, a single set of our 20172019 annual report to shareholders and our proxy statement, to households at which two or more shareholders reside, unless an affected shareholder has provided contrary instructions. Individual proxy cards or voting instruction forms (or electronic voting facilities), as applicable, will, however, continue to be provided for each shareholder account. This procedure, referred to as “householding,” reduces the volume of duplicate information received by shareholders, as well as our expenses. Upon written or oral request, we will promptly deliver, or arrange for delivery, of a separate copy of the Notice and, if applicable, a separate set of our annual report and other proxy materials to any shareholder at a shared address to which a single copy of any of those documents was delivered. To receive a separate copy of the Notice and, if applicable, a separate set of our annual report and proxy materials, you may write or call Broadridge Financial Solutions, Inc., 51 Mercedes Way, Edgewood, New York 11717, Attention: Householding Department, telephone(866) 540-7095. Shareholders currently sharing an address with another shareholder who wish to have only one copy of our Notice or annual report and other proxy materials delivered to the household in the future should also contact Broadridge Financial Solutions, Inc., 51 Mercedes Way, Edgewood, New York 11717, Attention: Householding Department, telephone(866) 540-7095.
7578
The Board of Directors of AGL does not know of any matters which may be presented at the Annual General Meeting other than those specifically set forth in the Notice of Annual General Meeting. If any other matters properly come before the meeting or any adjournment thereof, the persons named in the accompanying form of proxy and acting thereunder will vote in accordance with their best judgment with respect to such matters.
By Order of the Board of Directors,
Ling Chow
Secretary
7679


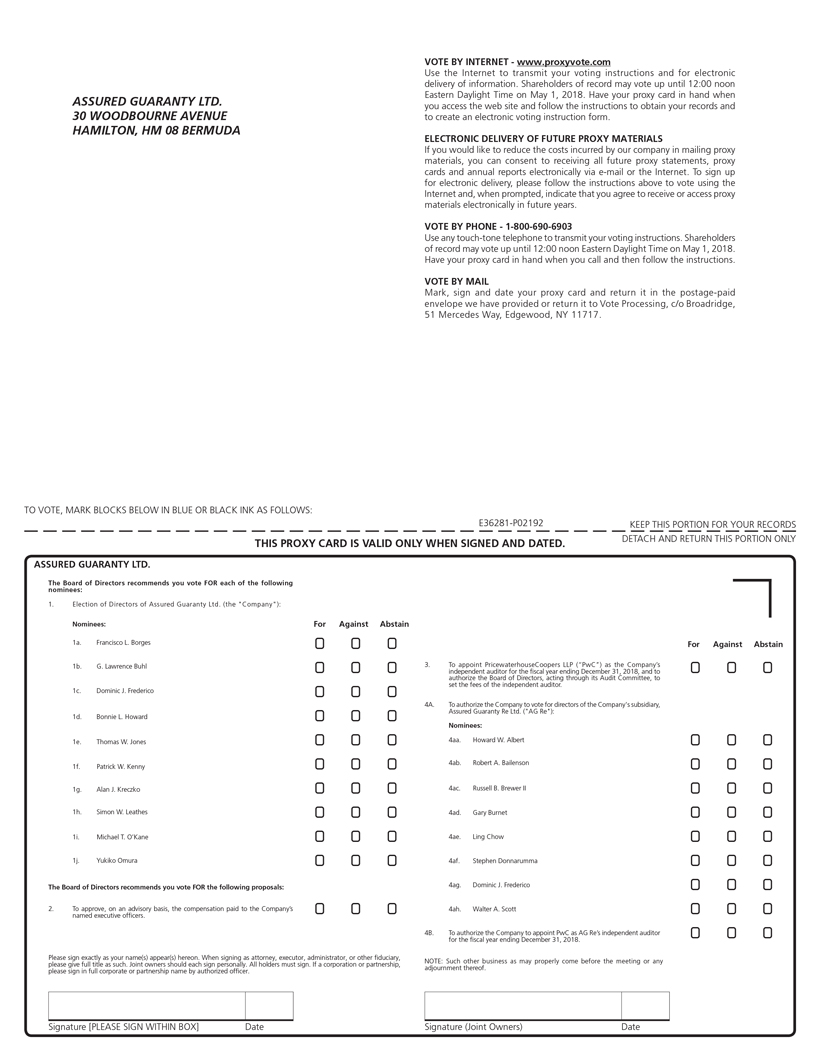

ASSURED GUARANTY LTD.30 WOODBOURNE AVENUEHAMILTON, HM 08 BERMUDA
VOTE BY INTERNET - www.proxyvote.com
Use the Internet to transmit your voting instructions and for electronic delivery of information. Shareholders of record may vote up until 12:4:00 noonPM Eastern Daylight Time on May 1, 2018.5, 2020. Have your proxy card in hand when you access the web ASSURED GUARANTY LTD. 30 WOODBOURNE AVENUE site and follow the instructions to obtain your records and to create an electronic HAMILTON, HM 08 BERMUDA voting instruction form.
ELECTRONIC DELIVERY OF FUTURE PROXY MATERIALS
If you would like to reduce the costs incurred by our company in mailing proxy materials, you can consent to receiving all future proxy statements, proxy cards and annual reports electronically via e-mail or the Internet. To sign up for electronic delivery, please follow the instructions above to vote using the Internet and, when prompted, indicate that you agree to receive or access proxy materials electronically in future years.
VOTE BY PHONE - 1-800-690-6903
Use any touch-tone telephone to transmit your voting instructions. Shareholders of record may vote up until 12:4:00 noonPM Eastern Daylight Time on May 1, 2018.5, 2020. Have your proxy card in hand when you call and then follow the instructions.
VOTE BY MAIL
Mark, sign and date your proxy card and return it in the postage-paid envelope we have provided or return it to Vote Processing, c/o Broadridge, 51 Mercedes Way, Edgewood, NY 11717.
TO VOTE, MARK BLOCKS BELOW IN BLUE OR BLACK INK AS FOLLOWS:E36281-P02192
E96611-P35431 KEEP THIS PORTION FOR YOUR RECORDS— — — — — — — — — — — — — — — — — — — — — — — — — — — — — — — — — — — — — — — — — —DETACH AND RETURN THIS PORTION ONLY
THIS PROXY CARD IS VALID ONLY WHEN SIGNED AND DATED.
DETACH AND RETURN THIS PORTION ONLY ASSURED GUARANTY LTD.
The nominees: Board of Directors recommends ayou vote FOR each of the following nominees:
1. Election of Directors of Assured Guaranty Ltd. (the “Company”):
Nominees:
For
Against
Abstain
1a. Francisco L. Borges ☐ ☐ ☐
! ! ! For Against Abstain 1b. G. Lawrence Buhl ☐ ☐ ☐
! ! ! 3. independent To appoint PricewaterhouseCoopers auditor for the fiscal year ending LLP (“PwC”) December as 31, the 2020, Company’s and to ! ! ! set authorize the fees the of Board the independent of Directors, auditor acting . through its Audit Committee, to 1c. Dominic J. Frederico ☐ ☐ ☐
! ! ! 4A. Assured To authorize Guaranty the Company Re Ltd. (“AG to vote Re”): for directors of the Company’s subsidiary, 1d. Bonnie L. Howard ☐ ☐ ☐
! ! ! For Against Abstain Nominees: 1e. Thomas W. Jones ☐ ☐ ☐
! ! ! 4aa. Howard W. Albert ! ! ! 4ab. Robert A. Bailenson 1f. Patrick W. Kenny ☐ ☐ ☐
! ! ! ! ! ! 1g. Alan J. Kreczko ☐ ☐ ☐
! ! ! 4ac. Russell B. Brewer II ! ! ! 1h. Simon W. Leathes ☐ ☐ ☐
! ! ! 4ad. Gary Burnet ! ! ! 1i. Michael T. O’Kane ☐ ☐ ☐
! ! ! 4ae. Ling Chow ! ! ! 1j. Yukiko Omura ☐ ☐ ☐
! ! ! 4af. Stephen Donnarumma ! ! ! The Board of Directors recommends you vote FOR the following proposal:
proposals: For Against Abstain 4ag. Dominic J. Frederico ! ! ! 2. named To approve, executive on an officers advisory . basis, the compensation paid to the Company’s named executive officers. ☐ ☐ ☐
! ! ! 4ah. Walter A. Scott ! ! ! 4B. To for authorize the fiscal the year Company ending December to appoint 31, PwC 2020 as .AG Re’s independent auditor ! ! ! Please sign exactly as your name(s) appear(s) hereon. When signing as attorney, executor, administrator, or other fiduciary,juduciary, NOTE: Such other business as may properly come before the meeting or any please give full title as such. Joint owners should each sign personally. All holders must sign. If a corporation or partnership, adjournment thereof. please sign in full corporate or partnership name by authorized officer.
Signature [PLEASE SIGN WITHIN BOX] DateForAgainstAbstain3. To appoint PricewaterhouseCoopers LLP (“PwC”) as the Company’s independent auditor for the fiscal year ending December 31, 2018, and to authorize the Board of Directors, acting through its Audit Committee, to set the fees of the independent auditor. ☐ ☐ ☐4A. To authorize the Company to vote for directors of the Company’s subsidiary, Assured Guaranty Re Ltd. (“AG Re”):Nominees:4aa. Howard W. Albert ☐ ☐ ☐4ab. Robert A. Bailenson ☐ ☐ ☐4ac. Russell B. Brewer II ☐ ☐ ☐4ad. Gary Burnet ☐ ☐ ☐4ae. Ling Chow ☐ ☐ ☐4af. Stephen Donnarumma ☐ ☐ ☐4ag. Dominic J. Frederico ☐ ☐ ☐4ah. Walter A. Scott ☐ ☐ ☐4B. To authorize the Company to appoint PwC as AG Re’s independent auditor for the fiscal year ending December 31, 2018 ☐ ☐ ☐NOTE: Such other business as may properly come before the meeting or any adjournment thereof.
Signature (Joint Owners) Date
Important Notice Regarding the Availability of Proxy Materials for the Annual General Meeting:
The Notice and Proxy Statement and Annual Report are available at www.proxyvote.com.E36282-P02192
PROXY
THIS PROXY IS SOLICITED ON BEHALF OF THE DIRECTORS
OF ASSURED GUARANTY LTD.
The undersigned hereby appoints Dominic J. Frederico, Nicholas J. Proud and Ling Chow, and each of them, with power to act without the other and with power of substitution, as proxies and attorneys-in-fact and hereby authorizes them to represent and vote, as provided on the other side, all the common shares of Assured Guaranty Ltd. which the undersigned is entitled to vote and, in their discretion, to vote upon such other business as may properly come before the Annual General Meeting of shareholders of the Company to be held May 2, 2018,6, 2020 or any adjournment thereof, with all powers which the undersigned would possess if present at the meeting.
THIS PROXY CARD, WHEN PROPERLY EXECUTED, WILL BE VOTED IN THE MANNER DIRECTED HEREIN BY THE UNDERSIGNED. IF NO DIRECTION IS MADE BUT THE CARD IS SIGNED, THIS PROXY CARD WILL BE VOTED FOR THE ELECTION OF ALL NOMINEES UNDER PROPOSALS 1 AND 4A, FOR PROPOSALS 2, 3 AND 4B AND IN THE DISCRETION OF THE PROXIES WITH RESPECT TO SUCH OTHER BUSINESS AS MAY PROPERLY COME BEFORE THE MEETING.
Continued and to be signed on reverse side